
Importance of SMS Performance Monitoring Dashboards

Aviation safety charts gather and present aviation safety management systems (SMS) information to stakeholders. Stakeholders can then use this information to make decisions and possibly change behaviors.
One of the most popular, time-efficient ways to monitor SMS performance is by using a safety performance dashboard that is tied directly into an SMS database. The SMS database allows management to participate in fact-based decision-making processes in real time.
SMS performance monitoring dashboards may be accessed either on a daily or weekly basis, depending on the role a manager plays in the SMS implementation, whether they are:
- Safety committee member;
- Safety manager;
- Operational department head; or
- Accountable executive.
Related Aviation SMS Performance Monitoring Articles
- 4 Pillars | How to Conduct Safety Performance Monitoring and Measurement
- 5 Useful Safety Performance Monitoring Tools in Aviation SMS
- How to Be Compliant With ICAO Safety Performance Monitoring and Measurement
Reported Safety Issues by Department
This article takes a look at an SMS performance report that has value in every SMS dashboard, regardless of which aviation SMS software you use. This "Safety Issues by Department" chart shows us the number of reported safety issues that are related to each of your organization’s departments for a defined time period. On the surface, the graph may be nothing more than something interesting to glance at.
But in reality, the Issues by Department report actually sheds some very valuable information about the overall performance of the aviation SMS and for:
- Performance by department; and
- Breakdowns in safety performance
More on these things later. To see these charts in action, below are some videos to watch.

Higher Numbers Can Be a Good Safety Performance Indicator

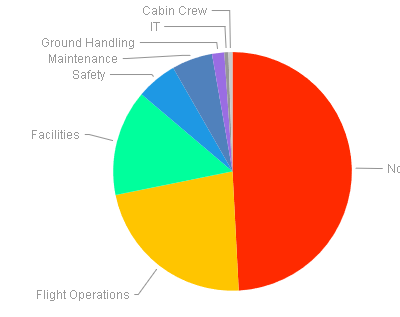
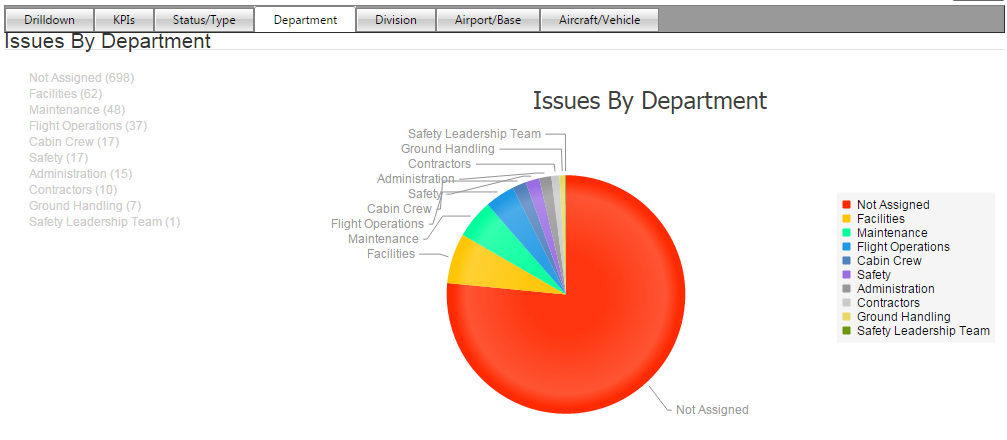
In an SMS database, performance monitoring charts can pull data in real time to display the latest information to managers. In the example chart below, we see the top five departments that are associated with reported safety issues.
As you can see,
- 40 safety issues are associated with the Facilities department,
- 39 from Maintenance,
- 28 from Flight Operations, and so on.
Caution: Don't jump to conclusions that departments with the most reported safety issues are your "problem areas" or operational areas with the most inherent risk. It may be that these departments have the highest exposure to hazards and hazard-related consequences.
There is not enough information available from this chart to make a final determination as to what is causing these differences in safety reporting metrics. It could be that these departments with the highest number of associated safety issues have the healthiest safety reporting culture. Again, we cannot make this determination yet.
This chart comes from the SMS Pro database. The database offers a high degree of flexibility for having one or multiple divisions. Within each division, you can break the company down further into logical, functional departments. If you care to learn more about this advanced SMS database configuration, see these related articles:
If your company or division has more than five departments, only the top five reporting departments will appear on this performance monitoring dashboard chart. To see more details, you will need a more elaborate chart, such as one in the following Risk Analysis Charts Module.
What Does This Dashboard Chart Say of the SMS' Performance?
At first glance this performance chart seems fairly simple. But in reality, this chart can deceive you into jumping to the wrong conclusion. Don't discount its value yet. There is a lot of useful information that can be gathered from it.
For one, the chart may appear as a representation of the departments' safety reporting culture.
Safety reporting numbers are important for two reasons:
- They can reveal and uncover departments that aren’t participating in the SMS;
- They establish a breakdown of employees' involvement in the SMS
- They represent the department head's ability to influence employees to support the SMS when you infer employees follow their immediate manager's lead
Most importantly, involvement plus substandard-reporting metrics are the two markers aviation safety managers can use to sniff out resistance in aviation SMS. Finding resistance in aviation SMS is something that many safety managers struggle with, especially during the first two phases of the SMS implementation.
In order to overcome resistance, safety managers need to know where to look. Enter "Safety Issues by Department" monitoring dashboard chart. In our example image, if I were concerned about resistance in my safety program, I can immediately see that the last two department’s reporting numbers are significantly lower than the other three departments.
Of course, this could be because:
- There are fewer employees in those departments
- Those departments are such that they should have lower reporting numbers, due to less operational exposure
OR, they might be underperforming and lack any semblance of dedicated involvement in the SMS. This leads me to my next point:
Related Articles on Employee Resistance to Aviation SMS
- How to Get Employees Participating in Safety Reporting - Aviation SMS
- Why Employees Don’t Care About Your Aviation SMS – and How to Fix It!
- How to Engage Difficult Employees in Aviation SMS
Things to Watch Out For

There are several things to keep in mind when looking at the metrics behind reported safety issues by department chart.
The most obvious is the trend of the chart:
- Which department(s) are reporting?
- Which department(s) aren’t reporting?
- Are these numbers comparably consistent over time?
As you are probably well aware, the answer to these questions cannot be taken at face value. You will have to put on your detective hat and possibly consult support performance monitoring charts. Each department’s safety reporting numbers should reflect:
- How their total number relates to what you would expect they should have
- How they relate to other departments
- Any recent safety promotion events, such as training
If all reporting numbers are low across the company, then that is probably symptomatic of poor organization-wide safety performance. If only a department or two are under-performing, then that could be a conspicuous sign of resistance, or at the very least, lack of safety promotion or involvement in the SMS.
In either case, odd safety reporting numbers from a department certainly would warrant further investigation, regardless of whether they were high or low. When there are sudden spikes in safety reporting metrics, one must determine what may have influenced the desirable behavior. Was there a recent:
- Accident or incident that "shook up" the department, thus increasing awareness;
- Safety newsletter;
- Safety training course;
- Hazard identification training?
Understanding what safety promotion activities are most effective for improving safety reporting metrics becomes very valuable. When safety managers have two or three tricks up their sleeves, they can pull these tricks out when times are tough. Do you know those times? When you have one or two reports during the month for 300 employees?
What do you do? In these cases, more hazard identification training may pull the organization out of this rut. When safety reporting metrics are abysmally low, this is the first area I'd consider. Hazard identification training can be formal, in-class training, or the more informal type, such as:
- Safety newsletters;
- Safety surveys (with a slant toward hazard identification and safety reporting processes);
- Safety banners;
- Safety meetings (quick five to ten-minute training sessions).
Related Aviation Hazard Identification Articles
- 4 Pillars | What Is Hazard Identification in Aviation SMS
- Understanding Role of Hazard Identification Training and Safety Reporting Forms in Aviation SMS
- Safety Chart: Where to Focus Hazard Identification
How to Tabulate Safety Issues by Department Data?
The following is an example of how your airline, airport, or maintenance company can create this report for your SMS performance monitoring dashboard. Employees, contractors, and vendors are interacting with your operations. When they detect something unusual, they will report safety issues as part of the Safety Assurance (SA) process. A logical question is how we associate reported safety issues with a particular department.
Associating individual safety issues with a department can be done using either of these strategies, based on your SMS database capabilities:
- Reporter defines associated department when submitting safety reporting form; or
- Manager associates department during reactive risk management process.
I prefer the second choice because a reporter may not understand the organizational structure well enough to choose which department the safety issue belongs to. Safety managers are in a better position to select the proper department when they are engaged in their routine risk management activities. In this case, the preferred workflow, which is very logical will be as follows:
- Reporter submits safety issue;
- Safety manager is notified of reported safety issue;
- Safety manager evaluates risk and determines a deadline to complete risk management activities;
- Safety manager assigns the reported safety issue to the department and operational department head with risk acceptance authority;
- Department head performs mitigation activities.

Reported safety issues should tabulate themselves based on which department the safety issue was associated with when it was classified by the safety manager. Automating these risk management processes is more sustainable for larger companies. Even smaller companies benefit from SMS databases when they have complex operations or they suffer from high employee turnover.
When your company has 40 or more employees, you should consider automating these processes using a low-cost, commercially available SMS database. An SMS database provides your company with best-in-class risk management processes and the tools necessary to take your company to the predictive risk management phase.
In some aviation SMS software programs, such as SMS Pro, departments are different from divisions. A division is a larger organizational unit made up of smaller functional units typically called departments. If your operation has more than one division, the "Issues by Department" chart will look different for each Division, as each division has its own set of Departments, some of which may be unique.
Related Aviation Risk Management Articles
- Difference Between Reactive, Predictive and Proactive Risk Management in Aviation SMS
- How to Practice Reactive, Proactive, and Predictive Risk Management in Aviation SMS
- Going From Reactive to Predictive Risk Management in Aviation SMS
How Does This Performance Monitoring Chart Relate to SMS Requirements?
One of the fantastic things about this chart is that it touches on a couple of the aviation SMS' four pillars.
Mainly, when we talk about hazard identification and safety reporting and why it’s important, we are talking about:
- Safety Assurance (SA) monitoring processes
In so many ways, Reported Safety Issues by Department allows aviation safety managers to assess which departments are most exposed to hazards or are inherently most vulnerable to risks. This assumption relies on low safety performance metrics (which means higher risk) or because a particular department’s environment happens to be fraught with risk.
Knowing which Departments are reporting the most safety concerns allows a safety manager to analyze that department and see which particular hazards and their associated risks are most prevalent. This leads us to:
- Safety Risk Management (SRM) to review
- system design;
- hazards;
- hazard related consequences; and
- risk controls.
Of course, those of you who are already very familiar with the four pillars would recognize this chart as being ostensibly for safety performance monitoring. Which is certainly true.
At its most basic level, the Safety Issues by Department chart is exactly that: an SMS performance monitoring tool that provides a measurement of safety reporting culture. Safety culture leads us naturally to:
- Safety Promotion
Indirectly, this graph can play a powerful role in informing management WHERE in an organization they need to focus their safety promotion efforts. Likewise, they may also infer how effective their safety promotion tools are. For example, for underperforming departments, a safety manager will know right away he/she needs to give that department some extra attention with formal and informal safety promotion efforts.
Related Aviation SMS Performance Monitoring Articles
- My Safety Score - What's Yours? Aviation SMS Performance Monitoring
- FAA Part 5 Compliance | Safety Assurance Performance Monitoring and Data Acquisition Components
- KPI Dashboard Monitoring Guidelines for Aviation SMS Programs - With Free KPI Resources

Who Should Care About This SMS Performance Chart?
Directly, this Safety Issues by Department graph is of most concern to a safety manager for being able to assess and monitor the strong and weak spots of his aviation organization's safety culture as a whole.
More specifically, it allows safety managers to also monitor the performance of Department Heads. Department heads with risk acceptance authority are managing safety issues within their department. Operational department heads interact with and influence employee behavior in their department much more than Safety Managers are able to.
There are times when substandard safety reporting metrics lead safety managers to department heads who are subverting the SMS. When safety managers have fact-based data charts to back up their suspicions, they are much better prepared to make the case than with merely empty suspicions.
This dashboard performance chart is also relevant to Department heads as a measure of their success in cultivating a healthy safety culture within their department. So while safety managers can target substandard safety performance very quickly with these charts, an alternate approach would be to focus more strongly on the performant departments and set them as "examples to follow."
Accountable executives should find value in this chart by comparing departments' safety reporting culture and taking steps to remedy departments with substandard reporting numbers.
Related Aviation Safety Culture Articles
- 20 Indicators What Good Aviation Safety Culture Looks Like [With Free Checklist]
- How to Change Toxic Safety Cultures in Aviation SMS
- What Does Aviation Safety Culture Look Like?
Final Thought: Other Relevant Performance Monitoring Graphs
A couple of other resources that work well with this chart are
- Trending charts – which allow a safety manager to delve into even more detail and compare the trends over time
- Types of Issues Graph – which allows a safety manager to draw a correlation (if any) of symptomatic types of issues in particular Departments
Though at first glance, this chart seems like a fairly simple and intuitive SMS monitoring tool. However, the Safety Issues by Department chart actually has considerable depth and power when used in an SMS performance monitoring dashboard.
Do you have an SMS Performance Monitoring Dashboard? If you want to build your own or see what your SMS database provider can create for you, look at this example. This is a very good SMS Performance Dashboard.
Live SMS Pro Demo
Have questions? Want your own SMS performance monitoring dashboard to deliver real-time charts? Sign up for a live demo.

Last updated April 2026.
