
Why KPI Charts Matter

The main continuous improvement activities for maturing aviation safety management systems (SMS) following an ICAO-compliant SMS implementation include developing:
- key safety performance indicators (KPIs); and
- safety goal and objectives tied to KPIs.
Since KPIs are set to track safety goals and objectives, KPIs are a big deal. They are generally associated with the baseline or core performance of an aviation SMS. Choosing great aviation SMS KPIs takes
- time,
- experience, and
- hunches by safety managers.
Once KPIs have been chosen, monitored KPI data can become a powerful visual tool for demonstrating historical SMS performance.
Related Articles on Aviation SMS Key Performance Indicators (KPIs)
- What Is a Key Performance Indicator (KPI) in Aviation SMS? - With Free KPI Resources
- How to Automate Key Performance Indicator KPI Monitoring in Aviation SMS
- What Is the Number One KPI in the Aviation Business?
Specifically, visualizing KPI safety information in charts shows an SMS’ lagging indicators or the output performance of an SMS' documented activity. KPI data significantly influences:
- How managers choose leading indicators;
- The steps management takes for proactive risk management activities; and
- The changes they make to SMS' risk management processes.
Moreover, the process of choosing KPIs is a direct reflection of corporate direction and management values. KPIs should align with organizational safety goals, and demonstrate to non-management employees what matters to upper management. KPI safety charts are extremely useful to these ends because they are a visual representation of those values.

What KPI Charts Reveal About Your Aviation SMS
Choosing KPIs can be extremely intimidating for the uninitiated. Once you go through the process a couple of times, you will feel more confident selecting KPIs. The best KPI selection tips to remember are:
- KPIs don't have to be perfect;
- KPIs have a high degree of subjectivity;
- KPIs should align with organizational safety goals and objectives; and
- KPIs may not indirectly monitor goals and objectives.
So where does a safety manager start when selecting KPIs? I believe much of the indecisiveness and apprehension in selecting KPIs stems from the fact that these selected KPIs will be reviewed and monitored by many stakeholders, including:
- Accountable executive;
- Senior management;
- SMS regulatory inspectors; and
- Employees.
Choosing the right place to start selecting KPIs is tough. To make the selection process less intimidating, start by reviewing organizational goals and objectives. The next step would be to review organizational safety goals and objectives. If you don't have any safety goals and objectives, I recommend holding a safety committee meeting and establishing safety goals and objectives that also align closely with organizational goals. Then review the available data sources that can demonstrate SMS activity.
It will be easy to become overwhelmed. There may be hundreds of metrics to choose from. There is considerable guidance and plenty of material available online for choosing KPIs. Yet KPIs must not be selected in the isolated vacuum of the safety department. Senior management must be involved as management must participate in identifying which KPIs are most relevant to their SMS.
Moreover, safety managers know how critical KPIs are for:
- Showing the core SMS performance;
- Indicating the primary values of management and the SMS; and
- Influencing the decisions management makes for proactive risk management.
In other words, misguided KPI choices can lead to misguided expectations and assumptions about an SMS implementation. When key performance indicators are chosen well, managers can generate meaningful reports for upper management to make informed, fact-based decisions to prepare for the future.
Related Articles on Aviation SMS Key Performance Indicators (KPIs)
- 6 Sources for Aviation Key Performance Indicators - With Free KPI Resources
- Signs of Good KPIs in Aviation
- How to Compare Your SMS KPIs With Industry KPIs

Things to Watch Out For
The biggest worry with KPIs is to make sure that the chosen KPIs are meaningful.
Effective KPI charts are extremely beneficial in this regard. A tabular list of KPIs may look relevant and reasonable, but when that same list is represented visually in a chart or graph, it is much easier to grasp which data is more useful in the decision-making process.
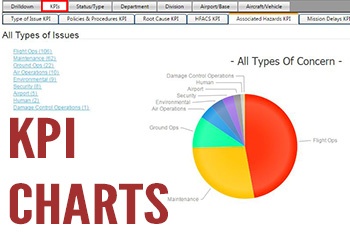
For example, an organization might choose the associated hazard “Damage Control Operations” as a key performance indicator. That sounds reasonable enough. But then managers might display a KPI chart for types of associated hazards reported and see that KPI offers no real value.
KPIs should always be considered based on their value, and visual charts help clarify a metric's decision-making value.
Related Articles on Aviation SMS Key Performance Indicators (KPIs)
- 5 Tips for Controlling Aviation Key Performance Indicators
- 3 Best Tips Selecting Aviation SMS Key Performance Indicators
- How to Best Monitor KPIs in Your Aviation SMS
How Are KPI Charts Data Tabulated?
Being able to create meaningful KPI charts requires several things:
- A professional hazard risk register with an integrated safety issue tracking system (or two separate point solutions);
- A list of key performance indicators; and
- A way of associating safety issues with identified KPIs.
With these three things in hand, managers should easily be able to manually create charts or let their aviation SMS software automatically create charts for them.
Setting and monitoring KPIs is one of the biggest challenges for operators using spreadsheets as their predominant SMS data management strategy. Spreadsheets are difficult to manage in a collaborative environment and impossible to monitor KPIs in real time.
An SMS database is suited for:
- selecting KPIs;
- assigning KPIs to safety issues during the risk management process;
- alerting management of developing KPI trends; and
- automatically generating charts and graphs for decision-making processes.

If you are interested in monitoring KPIs in real-time, then your SMS data should be managed in an SMS database. You can either build one yourself or if your time or expertise is lacking, a commercial-off-the-shelf product is a preferred route. When operators choose to build their systems in-house, they usually do well for the first four to six years. By then, the SMS implementation will be fully mature, and key business questions will become more demanding. Your software development time for the in-house solution continues to mount as the SMS implementation matures.
Several low-cost, commercially available SMS databases automate KPI tracking, monitoring, and report generation. If your company has more than 100 employees and you wish to track KPIs, you will need an SMS database to facilitate KPI management. Otherwise, the workload will be too much and the results very... shallow, dubious, and suspicious.
KPI data originates primarily from safety assurance processes revolving around the two most salient data collection opportunities in the SMS:
- Safety reporting system; and
- Auditing system.
Since KPIs are tied to safety goals and objectives, safety managers will need multiple, measurable data points to monitor whether SMS performance goals are being satisfied. As reported safety issues and audit findings enter the SMS risk management pipeline, it will be a best practice to classify or categorize these safety issues in a timely fashion. Do not delay. A good SMS database will allow classification at any time of the risk management process, but it is better to classify safety issues as soon as possible.
There are benefits to classifying safety issues as soon as possible. The most obvious is that the SMS database automatically alerts management of developing trends. For automated trend management to deliver the best results, safety issues must be classified early. But there are, of course, more important reasons for classifying safety issues:
- Determine root cause;
- Review associated hazards;
- Conduct safety risk analysis and assessment; and
- Review existing risk controls.
Classifying safety issues facilitates the risk management process. During the daily problem-solving processes, we are continually going through this "option weighing" risk management scenario. The difference is that SMS risk management processes are documented. When documented in an SMS database, management can react to data in real time.
If you did not catch that point, a best practice is to classify your safety issues early in the process. It allows the accountable executive and safety teams to monitor SMS performance in real time. Since your KPI charting data is dependent on the SMS database, the sooner you document your risk management activities, the more accurate your KPI monitoring charts will be.
Related Articles on Aviation SMS Key Performance Indicators (KPIs)
- 4 Pillars | The Truth About SMS Continuous Improvement and KPIs
- What Are Best Practices for Key Performance Indicators in Aviation SMS
- Essential KPIs for Poor Hazard Reporting Cultures in Aviation SMS

How These Charts Relate to SMS Requirements?
While KPIs don’t directly relate to any SMS requirements per se, they have heavy implications on demonstrating where aviation SMS are or are not meeting requirements.
For one, aviation KPI charts can be used to show:
- Continuous improvement;
- SMS implementation development;
- Compliance improvement;
- Safety reporting activity; and
- Demonstration of a functioning SMS.
In many ways, KPIs are at the very core of monitoring an aviation SMS' performance as related to the four pillars:
- Safety Policy: changes to procedures and policy will be made in response to KPI data;
- Safety Assurance: the basis of SMS KPIs are to evaluate performance;
- Safety Risk Management: weaknesses in KPI data will clearly indicate where inadequacies exist in the SMS;
The far-reaching implications of safety KPIs are not merely of prescriptive-based performance, but also to allow aviation SMS to set KPIs for organizational goals and operational performance goals. There is an opportunity to use collected SMS data to improve core business processes, and not merely "safety issues."
Related Articles on Aviation SMS Key Performance Indicators (KPIs)
- 7 Tips for Key Performance Indicator (KPI) Monitoring Strategy
- How to Choose KPIs in Aviation SMS Programs - With Free KPI Resources
- 5 Rules for Selecting KPIs in Aviation SMS - With Free KPI Resources
Who Should Care About This Chart?

This chart truly is the responsibility of everyone. Safety management teams are tasked with improving safety and monitoring safety assurance activities with key performance indicators.
Upper management is ultimately responsible for the success of the SMS implementation. They are providing resources for the SMS, and therefore have a vested interest in its performance.
Moreover, non-managerial employees need to know what the core concerns and values of management are – and they need look no further than which KPIs are in place. Knowing the values and concerns of management gives employees to focus on hazard identification and which areas of operational performance are most important.
Related Safety Charts
A fantastic way to put KPI safety charts in perspective is to compare them to their non-KPI counterpart. For example, safety managers can use:
- A KPI chart for Types of Reported Safety Issues;
- Compare it to a chart for organizational Types of Reported Issues; and
- Look for consistencies between the two.
To get the most out of aviation safety KPIs, an SMS database provides the best results for quickly providing actionable, decision-making information. Since 2007, SMS Pro has been working with aviation safety professionals around the world to provide a best-in-class SMS database.
Learn whether this SMS database can provide value to your organization.

Last updated in February 2026.
