
Importance for Visualizing Management's Risk Management Performance

Aviation safety charts gather and present aviation safety management system (SMS) information to stakeholders, who can then use this information to make informed, fact-based decisions. Safety charts can also influence safety culture, either for the better or the worse.
We started creating performance monitoring dashboards for managers approximately ten years ago. By far, the most talked about safety chart in the SMS database is the on-time task performance chart. When all employees and management have transparent visibility into the aviation SMS, management is held to a higher level of accountability.
A safety chart at the right will mean different things to different people based on their role in aviation, whether you are the:
- Accountable executive;
- Process owner or operational department head;
- Safety team member; or
- Line-level employee.
This chart is the chart of all charts that compels accountable executives to pick up the phone and ask:
- What is going on in the SMS?
- Why are we not at 100% on-time completion?
- What can we do to improve our SMS performance?
Related Articles on SMS Performance Monitoring Charts
- SMS Chart: Where to Focus Hazard Identification Training & Risk Mitigation
- Understanding "Root Cause Analysis" Charts in Aviation SMS Dashboards
- How to Monitor Aviation Safety Reporting Culture Using Safety Charts
This article analyzes the On-time Task Completion Chart, which shows:

- The targeted goal percentage for completing Corrective Actions and Preventative Actions (CPAs) on time;
- The actual percentage for completing CPAs on time;
- The targeted goal percentage for closing reported safety issues on time;
- The actual percentage for closing reported issues on time; and
- Task performance description indicating how well items are being closed, such as “Good” or “Excellent.”
This chart becomes an extremely valuable visual of how well management is meeting its safety performance goals. Completing CPAs and closing safety issues are fundamental risk management tasks that involve:
- Assessing risk;
- Reviewing affected systems;
- Analyzing hazards;
- Evaluating existing risk controls;
- Determining effectiveness of risk controls; and
- Adjusting control measure strategy when risk is not as low as reasonably practical (ALARP).
Controlling risk and avoiding "The Accident" can be considered the objective of aviation SMS. The sooner effective risk controls are implemented the less risk to operations.
This chart is important because, without it, aviation safety managers may have no idea if they are:
- consistently behind on managing important safety tasks; and
- mitigating operational risk as quickly as possible.
From the accountable executive's perspective, this is the main, go-to chart to monitor SMS performance and to direct necessary actions to correct substandard safety performance. Accountable executives are responsible for regularly reviewing operational safety performance.
This single chart speaks volumes to accountable executives. Based on the results displayed in this performance monitoring chart, the accountable executive may elect to investigate further to determine which actions may be necessary to improve organizational safety performance. One of the benefits of a centralized performance monitoring dashboard is that included safety charts cover a wide range of risk management topics that span all four pillars (or components) of the SMS.
Related Articles on Four Pillars in Aviation SMS
- What Are the 4 Pillars of SMS?
- 4 Pillars | What Safety Assurance Really Means in Aviation SMS
- 4 Pillars | What Is Hazard Identification in Aviation SMS

Reveals Performance of SMS Workflows and Management Attitudes
Being timely in completing risk management processes has strong correlations with the performance of safety managers and the department heads who are overseeing the management of reported safety issues.
The success of meeting targeted completion goals strongly indicates:
- Efficiency of aviation SMS' risk management workflows;
- Ability of managers to perform their duties well and on time;
- Communication and leadership abilities of managers;
- Quality of risk management processes; and
- How realistic management’s SMS performance goals are.
If the on-time task completion percentage for CPAs and safety concerns is consistently low, management will need to take a hard look at the risk management workflows and communication techniques. Consistently being behind in finishing safety tasks may be due to only one or two individuals. For example, an operational department head who is managing too many safety concerns may become overwhelmed. In this case, if the department head has many overdue safety tasks, this could misrepresent the operational performance of the entire SMS.
Regardless, if the percentage is low then management should focus investigatory efforts into the reason(s) why safety issues and CPAs are not being managed appropriately. Late closures are a risk in and of themselves. When safety performance is continually substandard, it could mean:
- Documented risk management processes are not realistic for closing safety tasks within prescribed time periods;
- Not enough resources are available to manage safety tasks;
- Bottle-necks exist that impede closing safety tasks within required time periods;
- Department heads do not prioritize safety concerns; or
- Organizational safety culture needs serious attention.

What to Watch Out For
There are a couple of things that management should keep a keen eye out for with the On-time Task Completion chart.
First, management needs to be aware of their actual on-time completion percentage in relation to their safety goals for closing issues/CPAs. Ideally, the two percentages should remain very close together, as that would indicate that management's safety goals and objectives are realistic. If management is consistently behind or too far ahead, then safety performance goals need to be reassessed.
Also, management will need to pay attention to the consistency between
- CPA's completion percentage and
- Safety issue completion percentage.
If CPA's percentage is either much higher or much lower, it could be a strong indication that:
- (If CPAs are late but safety issues are on time) Final risk assessments are being rushed to meet SMS deadlines; or
- (If CPAs are on time but safety issues are late) Implementation of corrective actions is sufficient in terms of scope, but safety managers are lax in their final assessments and closing documentation activities.
The relationship between CPAs and safety issue closure rates should be strongly correlative.
Related Articles on SMS Performance Monitoring Charts
- Safety Chart: How to Monitor Aviation Risk Management Priorities Using Heat Maps
- Safety Chart: How to Monitor Overall Risk Exposure of Aviation SMS
- SMS Chart: Monitor Aviation SMS Safety Performance by Department
Where Does This Chart Data Come From?

This chart reflects the effectiveness of organizational risk management processes. First, employees identify safety issues and report them in the safety reporting system. These reported issues are then reviewed and managed by aviation safety managers and assigned to a single department head, who may be a process owner or has risk acceptance authority in the affected "system."
This is a side note. The last sentence stated that the safety issue was assigned to a "single" department head. In reality, safety issues may be worked on by a safety committee. This is fine, but there must be a single point of responsibility. Otherwise, when an issue becomes overdue,
- Who is to blame?
- Who is in charge of direct correspondence to determine why the issue is not managed appropriately?
- Who doesn't look good when safety tasks repeatedly take a back seat to operational concerns?
Having a single operational department head as the responsible manager allows the accountable executive to most quickly determine "What is going wrong?"
During the initial risk management process, safety issues are reviewed and risk assessed. Initial mitigating actions may be assigned to contain the damage, "put out the fire" or "stop the bleeding." A targeted closure date for the reported safety issue will be set based on assessed priority, which is based on the risk index. A risk index is commonly calculated from a risk matrix based on the "probability" and "severity" of the related hazard(s).
A risk assessment is not performed on "what actually happened," but on what could reasonably happen should the hazard(s) manifest themselves in a future event. In short, safety teams are evaluating credit risk scenarios and not what actually happened. Why? In proactive hazard identification and reporting cultures, hazards are frequently reported before they affect operations. It does not make sense to risk assess proactive safety issues based on what has not happened, but the focus must be pointed toward "what could realistically happen?"
Based on the risk assessment, responsible managers will determine whether additional risk controls are necessary to mitigate risk to ALARP. CPAs are assigned to employees by their respective managers with deadlines. To create the "On-Time Task Completion" chart, we need to aggregate data for "when" assigned CPAs and safety issues are closed and compare these "completion dates" with the assigned deadlines.
Since these performance monitoring charts are linked directly to the SMS database, these charts are updated in real time. As risk management activities are documented in the SMS database, management (and possibly employees) observe the percentage of on-time task closures. In the case of SMS Pro, we only consider safety tasks that were closed on time within the previous 30 days.
Historical observations by safety teams allow them to set realistic targets for future safety performance goals. These safety goals and objectives must not be set without the involvement of the accountable executive and operational department heads. Management must have buy-in. Otherwise, they may not
- support unrealistic goals; or
- take ownership of the performance targets;
- be aware of management's concern regarding substandard safety performance.
Related Articles on SMS Performance Monitoring Charts
- Safety Chart: Are Your Aviation Safety Program’s Procedures Effective?
- Safety Chart: Monitor Aviation SMS Performance With Leading Indicators
- Safety Chart: Prioritize Critically Overdue Tasks in Aviation SMS
Far-Reaching Into SMS Requirements
The On-time Task Completion chart has important implications for how aviation SMS meet SMS requirements. These implications are both for meeting:
- SMS performance requirements; and
- SMS prescriptive requirements.
Prescriptive requirements are essentially how aviation SMS are compliant with oversight agencies’ requirements, such as the FAA, ICAO, or EASA. If CPAs and issues are not being managed in a timely manner, then it will be nearly impossible for them to meet many requirements.
Furthermore, aviation SMS should have performance requirements, such as aviation safety KPIs and organization-specific SMS goals. Once again, practicing inefficient risk management processes will make it very difficult to achieve performance goals.
Organizational safety goals and objectives are more than an annual burden for senior management and safety teams. Safety goals and objectives require regular monitoring to ensure that the organization can respond properly whenever substandard safety performance is detected. By having task performance metrics always visible, there will be no chance for a "hidden surprise" when SMS auditors visit to review SMS compliance and performance.
Safety promotion is an under-appreciated SMS component. This chart serves as a tremendous safety promotion tool. We have repeatedly seen how this chart alone improves safety performance in airlines, airports, and aviation maintenance organizations. I'm sure it affects our clients in other aviation industry segments, but the most visible performance improvement indications come from airlines, airports, and MROs (AMOs).
SMS administrators control which user groups can see this chart. for example, SMS Admins may allow only Executives and Department Heads to see this chart. Alternatively, the SMS may be very transparent and allow all employees to see their SMS task completion performance.
There is a small percentage of SMS Pro clients that hide this chart from line-level employees. These are companies that do not have transparent safety cultures. Oddly enough, but certainly logical, is that these companies hiding this chart from line-level employees are the ones with the poorest safety task completion performance. By showing this chart to all employees, I believe that the safety culture will improve by shaming managers who are not completing assigned safety tasks within prescribed time periods.
My suggestion is to "rip off the band-aid" and let all employees see this performance monitoring chart. It is amazing what happens. Within 30 days, you are sure to see significant improvements in SMS task completion performance. This act obviously requires management support and it sends a strong message to employees. The message is that:
- management is accountable;
- management is serious about the SMS;
- Department Heads can no longer hide behind hidden data sources; and
- SMS is a core business process!
Performance monitoring dashboard charts are HUGE safety promotion tools!
Related Articles on SMS Performance Monitoring Charts
- Safety Chart: Learning Who Is (or Isn't) Involved in Your Aviation SMS
- Aviation Safety Chart: Monitoring Hazard Reporting Culture Per Division
- 10 Great Reports to Monitor Safety Performance in SMS - With Examples

Who Should Care About This Chart?
This chart is the main concern of the safety team, including:
- accountable executives,
- safety managers,
- SMS inspectors, and
- safety committees.
Department heads are also very keen about this chart, as they are responsible for closing safety issues on time and managing employees assigned to their respective safety issues' CPAs.
The accountable executive who is providing financial resources and support for the SMS should also be highly invested in this chart. No accountable executive wants to be on the wrong side of a consistently underperforming SMS. Moreover, the potential financial ramifications from tardy safety issues and CPAs can be large – and would merely exist because management wasn’t able to implement risk controls on time.
Subtly, employees should also pay attention to this chart as well – they are the individuals who are reporting safety issues and are assigned to implement risk controls. Management has a responsibility to employees as well as executives to implement risk controls as quickly as possible, as safety employees are most directly affected by uncontrolled risk.

Similar Performance Monitoring Charts
There are approximately 45 small, performance monitoring charts in SMS Pro's Executive Dashboard. Some charts are able to tell a complete story by themselves, while other charts complement each other to describe a more complex story.
Safety professionals who have just started using SMS Pro tell us that the Executive Dashboard contains all the necessary charts and reports that they need for daily monitoring. Before using SMS Pro, these safety professionals spent obscene amounts of time creating safety reports that may only earn a quick glance from management. Management often does not realize the amount of time it takes to:
- collect data;
- aggregate and filter data;
- format charts; and
- deliver charts to management.
By using the real-time performance monitoring dashboard, senior management can simply log in and gain real-time access to SMS performance. They can monitor SMS performance without consuming additional safety team resources, thereby allowing the safety team to focus on delivering more safety services to stakeholders, such as:
- safety surveys;
- safety newsletters;
- safety culture analysis; and
- hazard identification training.
Two other dashboard charts that are extremely relevant to this one are
- Overdue Issues and CPAs (shown below at right); and
- Overdue Items (shown below at left).
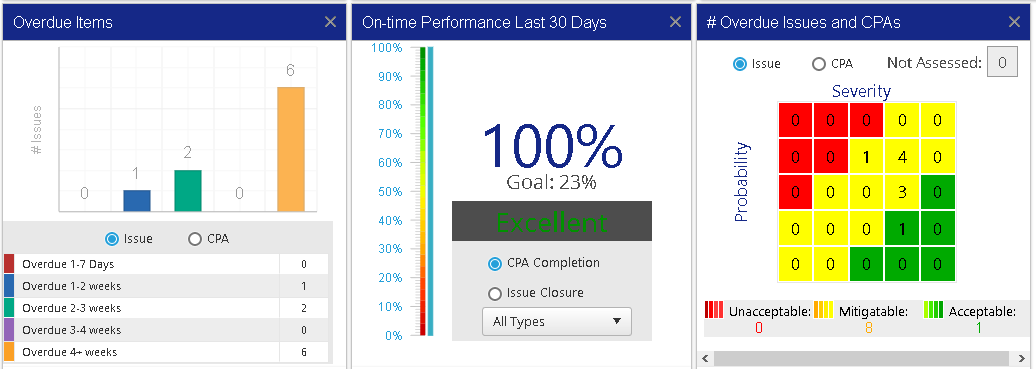
The first chart shows the number of reported safety issues and CPAs currently overdue by risk priority.
The "Overdue Items" chart shows how many items are overdue and by how many days.
Putting all three charts side by side, management can gain further insight into the current efficiency of their risk management performance.
These charts are not configured by default in the above configuration. SMS Pro's Executive Dashboard is personalized by each user based on their needs and by which charts management allows each user group to view. Users can drag and drop dashboard charts in a manner consistent with their needs.
If I were to pick the most important chart of the 45 available dashboard charts, I would choose the "On-time Performance" chart. Accountable executives and safety teams need this information to maintain operational safety assurance.
Related Articles on SMS Performance Monitoring Charts
- Safety Chart: Why Aviation SMS KPIs Visual Data Matters - With Free KPI Resources
- Safety Chart: Discover Most Relevant Aviation SMS Hazard Issue
- Safety Chart: Aviation Risk Management Task Delegation
Want to see these charts in action? Real-time dashboard charts are merely one aspect of a well-designed aviation safety database.
Learn how you can benefit from a low-cost, commercially available SMS database.

Live SMS Pro Demo
Have questions? Want to see SMS Pro live? Sign up for a live demo.

Last updated April 2026.
