
Why Associated Policies & Procedures Charts Matter

Policies and procedures are the central backbones of any aviation safety management system (SMS).
During aviation SMS audits, the adequacy of your policies and procedures will be looked at thoroughly. The safety of day-to-day behaviors will be greatly influenced by the quality of procedures being followed.
Tracking policies and procedures becomes critically important when these policies or procedures are risk controls that mitigate hazard-related consequences.
Related Aviation SMS Risk Control Articles
- What Is a Risk Control in Aviation SMS: Meaning, Purpose, Application
- Difference Between Hazards, Risks & Control Measures
- How to Monitor the Effectiveness of Control Measures
For safety professionals familiar with the Hierarchy of Controls, "Administrative Controls" are policies and procedures. They fit into the category of operational risk controls to:

- Detect hazards';
- Correct adverse affects of hazards; or
- Prevent hazards from adversely affecting operations.
Being able to monitor the effectiveness of policies and procedures in terms of producing repeatable, compliant safe behavior makes a big difference not only in the profitability of your operations but also for your aviation SMS, both in terms of being a prescriptive and performing program.
However – how exactly do you objectively monitor the effectiveness of your company's policies and procedures?
Maybe the question should be: "Are you monitoring the effectiveness of operational policies and procedures?"
If you are not monitoring the effectiveness of operational policies and procedures, how do you determine they are effective? How do you know when a procedure requires change?
"Failed risk controls" is one of the triggering conditions for starting a "Management of Change" project. There is an expectation that risk controls are monitored for effectiveness. Since risk controls include policies and procedures, it only makes sense that policies and procedures should be evaluated when relevant safety issues are reported into the safety reporting system.

Examples of Tracking Policies and Procedures' Effectiveness

Analyzing the number and type of policies and procedures that have been associated with reported safety and quality issues remains one great way to monitor their effectiveness. Yet not all aviation SMS have data management capabilities to accommodate this powerful risk management process.
Associating a particular policy or procedure with reported safety issues requires a database for a sustainable risk management process. Otherwise, safety professionals will be spending too much time trying to classify reported safety issues and generating reports.
In every SMS, risk management processes must be:
- easy to accomplish;
- in a repeatable fashion;
- for a prolonged period of many years.
When processes are not easy to accomplish, such as associating reported safety issues with affected policies or procedures, there is little hope that safety professionals will practice this process for any length of time. And this is a key point. In order for data charts to provide consistent, decision-making value, data must be managed for at least a year or more to aggregate enough data for a trend to appear.
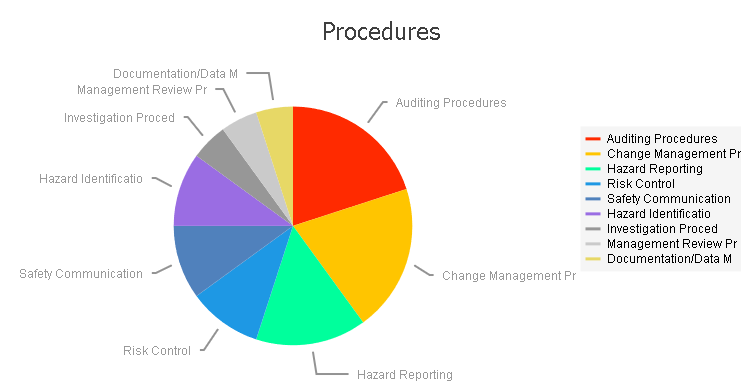
Putting that data into visual form (i.e., a chart) gives safety professionals and process owners perspective on this data that allows them to effectively modify ineffective procedures in a timely manner.
The important things the above chart displays are:
- The distribution of Associated Procedures; and
- The number of associated issues with each type of procedure.
One thing to note is that while the above example shows "Procedures," an equivalent chart for "Policies" should also be available in your aviation SMS database.
Related Articles on Monitoring SMS Performance Using Charts
- How to Monitor Aviation Safety Reporting Culture Using Safety Charts
- SMS Chart: Where to Focus Hazard Identification Training & Risk Mitigation
- Safety Chart: How to Monitor Aviation Risk Management Priorities Using Heat Maps

How This Safety Performance Monitoring Chart Is Used

SMS procedures for aviation service providers tend to be fairly extensive and, in terms of data, a little bit hard to manage. However, when we talk about using that data in useful ways, not every procedure needs to be tracked and considered.
Using SMS data for tracking types of procedures is a great balance between specific and easy-to-manage data (a nice way of saying: easy to make sense of). Types of procedure might be:
- SMS change management procedures;
- Hazard identification procedures; and
- Safety communication procedures.
What this chart reveals about your SMS implementation depends on how the procedures are being associated with safety issues and audit findings in real-world use cases. Aviation safety managers may associate safety issues with procedures because:
- An inadequate procedure contributed to the issue;
- No procedure existed where one is needed;
- Procedure was too complicated for employees to follow;
- Procedure was inconvenient to use (as we discussed above); or
- A procedure was highly relevant to the issue (for better or worse).
In most real-world scenarios – and we recommend this too – only inadequacy or lack of a procedure should be associated with safety issues. If used as #5 to merely state a "safety affect," this chart can’t really be used to assess the effectiveness of procedures but will be used to assess which types of procedures are most relevant to the overall scope of your organization.
When you are classifying safety issues, consistency is very important to achieve reliable results. When too many managers are classifying safety issues, or the process is not consistent, the chart's utility will become suspicious.
Related Articles on Monitoring SMS Performance Using Charts
- Safety Chart: How to Track Safety Reporting Performance in Aviation SMS
- How to Monitor Aviation SMS Responsiveness Using Safety Charts
- SMS Chart: Monitor Aviation SMS Safety Performance by Department
What Procedure Charts Reveal About Your Aviation SMS
Assuming that procedures are being associated with safety issues due to procedure inadequacy or lack thereof, you can glean some extremely useful, fact-based decision-making information:
- Procedure spread: by seeing which Associated Procedures take up the most room on the pie chart, you can immediately assess which types of procedures require the most attention; and
- Number of associated procedures: by referencing the number of Associated Procedures with safety hazards reported, you can assess how common procedure associations are in relation to the total number of reported safety issues and/or audit findings.
Obviously, the more common procedures are associated with safety issues, the more inadequate they are. By taking spread and number together, you can:
- Prioritize how effective your procedures are overall;
- Where your safety management system’s bureaucratic backbone is weakest; and
- What (if any) procedures require your immediate attention?
If you do identify some red flags, you will definitely want to investigate further to see which specific procedures are failing to be effective. One important thing to note, however, is that it’s also important to verify whether the root cause of a procedure’s problem is the procedure itself or the lack of following the procedure – this is an entirely different type of issue altogether (i.e. lack of training, Human Factors, etc.).

How Are Associated Procedures Charts Created
The data behind this chart is tabulated during the safety issues' risk management process. While safety managers or safety committees are managing/reviewing safety issues, they will associate one to many "risk management classifications" that affect the reported safety issue, such as Human Factors or hazards. There may be many types of classification schemes in an SMS database, such as SMS Pro. These classification schemes include:
- Types of Issues;
- Associated Hazards from Hazard Register;
- Human Factors;
- Root Causes;
- Policies and Procedures; etc.
Classification schemes are usually structured in a three-tier classification schema; however, you may see classification schemes extend to four or five layers deep. A best practice is to keep classification schemes to three levels, such as:
- Category;
- Sub-category;
- Classification.
In the case of Policies and Procedures, SMS Pro only has two levels:
- Policy or Procedure;
- Item Name (of policy or procedure).
Thorough organizations will also, if necessary, associate procedure category types (in the event of lack of procedure) or specific procedures (in the event of inadequate procedures) with the safety issue. A sophisticated aviation SMS database will easily be able to track this data and represent it in visual form.
Manual systems, such as Excel, will need to use some filtering magic to parse out the relevant data – but it will nonetheless be the most useful way to evaluate procedure effectiveness. So if you do not have an SMS database, you can still pull this stunt off using spreadsheets, but I doubt that any safety professional will want to do this for any length of time.
Related Articles on Monitoring SMS Performance Using Charts
- Safety Chart: How to Monitor Aviation SMS Task Performance
- Safety Chart: Prioritize Critically Overdue Tasks in Aviation SMS
- Safety Chart: Visually Presenting Aviation SMS KPIs - With Free KPI Resources
How This Chart Relates to SMS Requirements
It’s probably pretty clear how this chart relates to SMS requirements, mainly with:
- SMS implementation development; and
- SMS compliance.
With mature aviation SMS implementations in phase 4, their procedures will ideally be fairly rock-solid. Less mature programs may rely on this chart more as a guidepost for furthering SMS implementation and improving processes.
Accountable executives are responsible for regularly reviewing organizational safety performance and directing actions necessary to address substandard safety performance. This SMS performance monitoring chart can be used to validate the effectiveness of policies and procedures. In short, this chart demonstrates that accountable executives have the necessary tools to effectively monitor SMS performance.
Moreover, carriers are tasked with creating safety policy that is indicative of actual, real world behavior. To this effect aviation SMS that identifies problems with types of procedures will want to verify is
- the procedure OR
- the lack of following the procedure is the culprit for the issue.
Related Articles on Monitoring SMS Performance Using Charts
- Safety Chart: Risk Level Breakdown in Aviation SMS
- Aviation Safety Chart: Monitoring Hazard Reporting Culture Per Division
- Safety Chart: Discover Most Relevant Aviation SMS Hazard Issue
Who Should Care About This Chart?
While stakeholders will want to ensure that the outlined procedures are in line with compliance and are adequately creating a safer environment, front-line employees should be extremely concerned that the “rules” they are required to follow are indeed the safety ones.
In this respect, the effectiveness of procedures is of major concern for the process users and the user of said procedures.
When these procedures are risk controls, then this becomes a concern for a wider audience that will be participating in subsequent Management of Change projects. These user groups will include:
- Accountable executive;
- System's process owner(s);
- Safety team;
- Subject matter experts; and
- Regulatory authorities (if required).

Related Safety Charts
Two safety charts in SMS Pro's performance monitoring dashboard immediately come to similar minds and supplements by this chart:
- All Issues by Division: which will show you the total number of safety issues to compare against total Associated Procedures, as well as give you an indication of where in your company Associated Procedures are most relevant; and
- Associated Policies chart: policies and procedures are intimately tied together, and you may find trends between both this chart and Associated Procedures.
Related Articles on Monitoring SMS Performance Using Charts
- 4 Safety Charts for Department Heads Issue Management Performance
- Safety Chart: Monitor Aviation SMS Contributing Factors
- Safety Chart: Learn How Top Reporters Improve Your Aviation Safety Culture
Final Thoughts on SMS Performance Monitoring Charts
Every SMS has a safety policy that includes employees' protections from management for self-reporting errors and mistakes. These protections may be included in the safety policy statement or referred to in another, stand-alone safety policy that outlines these protections. This forms the basis of Just Culture and is required to achieve a healthy safety reporting culture.
Every SMS should have a non-punitive reporting policy.
How many employees believe in your non-punitive reporting policy? Or the better question should be: How many employees do not believe the non-punitive reporting policy?
How many times has the non-punitive reporting policy been violated?
How many time has the non-punitive reporting policy appeared to have been violated? In safety cultures, appearances are very powerful, even when appearances are not based on factual occurrences.
How do you track these data points that so critically affect the safety culture? It doesn't matter whether you are using SMS Pro or not. Being able to monitor policies and procedures is just as important as monitoring the effectiveness of risk controls, because as we highlighted earlier, some of your procedures may be risk controls that require monitoring.
We used the "non-punitive reporting policy" above merely as an example. We could have chosen any other policy you may have, such as:
- Maintaining adequate fuel reserves; or
- VFR into IFR.
Which policy you are tracking is not important for this discussion. What is important is that your SMS maintains the data management capabilities to measure and monitor the effectiveness of policies and procedures. If your SMS database does not allow you this feature, you should consider:
- Requesting this feature from your SMS database provider; or
- Plan to switch to SMS Pro, which does this very easily.
If you are already an SMS Pro user, this article was created specifically for you. We want to illustrate the importance of classifying your safety issues and audit findings using the "Policies and Procedures" features in your risk management process.
For those who are not SMS Pro users and want to see how you can benefit from this low-cost, commercially available SMS database, please watch these short demo videos:

Non-Punitive Reporting Policy Templates
How is your non-punitive reporting policy? Is it effective? You may wish to review your policy with one of our templates below:

Last updated January 2026.
