
Importance of SMS Performance Monitoring Charts

Aviation safety charts gather and present aviation safety management system (SMS) information to stakeholders, who can then use this information to make informed, fact-based decisions. Well-designed safety charts can take a complex idea and make it easily understandable with a simple picture, table, chart, or graph. In this case, the "report" behind the safety chart could easily be worth more than a thousand words.
A common challenge accountable executives and senior management have is monitoring the performance of their implemented SMS. Regular SMS performance monitoring is an important responsibility for every accountable executive, as they are responsible for addressing substandard safety performance whenever it is identified.
Management will therefore need to measure SMS performance in order to identify performance shortcomings.
Related Articles on Aviation SMS Performance Monitoring
- 4 Pillars | How to Conduct Safety Performance Monitoring and Measurement
- How to Set and Monitor Key Performance Indicators (KPIs) in Existing SMS
- 5 Useful Safety Performance Monitoring Tools in Aviation SMS
In this article, we will analyze a performance monitoring chart that should be included in every SMS data monitoring system.
This is a small chart that doesn't take up too much screen real estate. The small size makes this chart a perfect candidate to include in your SMS Performance Monitoring Dashboard.
This chart comes from the commercial SMS database called SMS Pro. We don't expect you to have this SMS database product and you do not need this software to make this chart. However, if you are using SMS Pro, you will find this, and over 40 other configurable charts available in the user-personalized SMS dashboard.

The “All Open Issues By Division” chart, provides a quick look at your SMS' safety reporting culture, as well as the current safety responsibilities management has on their plates.
The All Open Issues By Division chart allows users to see four critical things:
- Total number of open reported issues by division (area of operations)
- Total number of open audit issues
- Total number of open proactive issues
- Issues reported from each division that are open
This is an example chart that your aviation SMS database program should provide in real time.
What does "real-time" reporting mean in this case?
When a new safety issue is submitted into the SMS' safety reporting system, the division into which the safety issue was submitted will increase by one open safety issue. When any safety issue is closed within a division, the chart's numbers will decrease by one because the safety issue is no longer open.
In the case of this particular chart, safety managers can toggle which divisions are shown and hidden by clicking on their names below the pie chart.
The reason these numbers provide a quick look at an organization's safety reporting culture is twofold.
- The number of proactive safety issues in relation to total issues gives aviation safety management teams an idea of how proactive their SMS safety reporting culture is.
- Though the total number of reported safety issues on this chart comes from “real-time data,” a real-world use case would tell management how well they are doing at managing issues in a timely manner – i.e. every day is the total number of open issues growing, shrinking, or remaining consistent? Another example is: Will there always be approximately 200 open safety issues in the Flight Ops division?
Related Articles on Aviation SMS Performance Monitoring Charts
- Safety Chart: Overall Performance of Aviation SMS
- Safety Chart: Mandatory vs. Voluntary Aviation SMS Issues to Report
- Safety Chart: How Active Is Your Aviation Safety Reporting Culture
What This Chart Reveals About Your SMS Performance
In so many ways, the Open Issues By Division chart’s combined importance of-
- showing reporting culture and
- safety management’s efficiency in dealing with these issues
-reveals how efficient an aviation SMS' risk management processes are. Proactive reporting and timely management of reported safety issues cultivate high-performing aviation safety risk management activities, which is also the backbone and goal of all SMS.
Furthermore, because this chart allows users to filter open audit issues, real-world uses of this chart give safety managers a daily look at how compliant their SMS is. As in, the more open audit issues there are, the less compliant a safety program is.
Furthermore, being able to see which divisions are efficient at treating and closing their safety issues, and which divisions have many open safety issues, helps safety management identify where they need to focus their risk management efforts.

What to Watch Out For

There are a couple of real-world uses that an aviation safety manager would want to look out for as they keep daily tabs on this chart.
The first is relevant for organizations that have multiple divisions. In SMS Pro, a division could either be a functional division, such as:
- Flight Ops;
- Ground Handling;
- Air side;
- Ground side; etc.
Alternatively, divisions can be geographically separated operations managed by the same company, such as:
- North America;
- Middle East;
- Europe;
- Airport A;
- Airport B; etc.
In these cases, a safety manager would want to ensure that the pie chart remains fairly consistent in the number of open issues for each division commensurate to the size of the division and the level of hazard exposure relative to the other divisions. For example, a "Flight Ops" division would logically have more reported safety issues than the "Customer Care" division.
Once safety managers have a baseline of safety reporting metrics or a feel for how many safety issues should be coming from each division, the safety manager becomes better prepared to make some informed assumptions. If one division’s number of open safety issues grows or shrinks, it could be an indication that:
- Management is either improving efficiency in managing safety issues (fewer open safety issues)
- Management is falling behind in closing safety issues (more open items)
- Safety reporting culture is improving for particular division (more reported items)
- Safety reporting culture is declining for particular division (less reported issues)
There is a second and related aspect of this safety chart that an aviation safety manager would want to keep tabs on. An engaged safety manager will observe the daily fluctuation of the total number of reported safety issues. Healthy Aviation SMS will find a good balance between its safety reporting culture and management’s ability to manage issues. Such a balance will reflect a fairly consistent number of open safety issues at any one time.
The main point is that with daily checkups, any consistent trends of growing or shrinking open safety issues would definitely require some further investigation by a safety manager.
Related Articles on Aviation SMS Performance Monitoring Charts
- Safety Chart: Monitor Aviation SMS Contributing Factors
- Safety Chart: Learn How Top Reporters Improve Your Aviation Safety Culture
- Safety Chart: Track Your Aviation SMS Implementation

Where This Aviation Safety Data Comes From
The data for this chart is tabulated from at least two different systems, depending on your SMS data management strategies. Most of this system's performance monitoring data come from the safety reporting system, while the remainder will come from the auditing system.
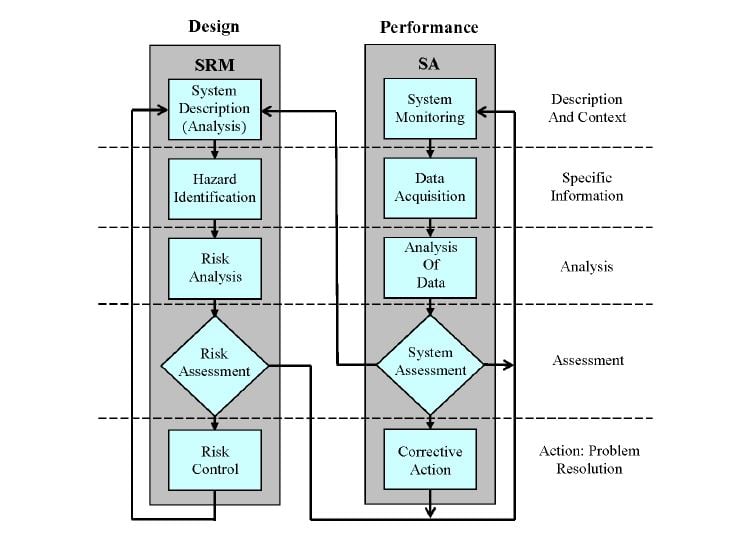
In the image below, we see the inter-relationship between safety risk management (SRM) and safety assurance (SA) processes. On the "Performance" side, we see the "Data Acquisition" process. These are the safety reports and audit findings that power the "Open Issues By Division" chart. The next three sections of the "SA" side are the risk management processes, of which "safety issues" must pass through.
In your risk management tools, each safety issue has a certain status, such as “Open,” “In Progress,” “Closed,” and so forth. The chart in the SMS Pro database displays all issues that do not have a status of “Closed,” as the assumption is that all safety issues are open unless they are closed. As new safety issues are submitted and existing issues are closed, the chart will change accordingly.
Related Articles on Aviation SMS Performance Monitoring Charts
- Safety Chart: Discover Most Relevant Aviation SMS Hazard Issue
- Safety Chart: Who (Isn’t) Involved in Your Aviation SMS
- Safety Chart: Track Safety Performance in Aviation SMS
How to Monitor Proactive Safety Issues In Aviation SMS
The safety performance monitoring chart at the right has three filters above the pie chart:
- Reported safety issues;
- Audit findings; and
- Proactive items.
Let's consider “Proactive” safety issues. Hopefully, safety managers have the ability to flag (or mark) safety issues as “Proactive” if that item was proactively identified and reported. Whenever safety issues have been flagged as “proactive," the Open Issues By Division chart will filter them when users select the “Proactive” box on the chart.
Finally, if your aviation SMS data management capabilities possess an integrated auditing system, audits or prep audits will produce “findings” to be managed in the risk management tools as audit issues. Whenever a user clicks on the chart’s Audit filter above, for example, it will filter all open audit findings.
If you don't have an auditing system yet, check out the following auditing system. It easily handles IOSA and ISAGO audits, as well as has the ability to:
- Create custom auditing forms;
- Schedule audits;
- Create auditing plans;
- Conducts audits; and
- Manages audit findings.

How This Data Relates to SMS Requirements
Much of what this chart tells management has to do with monitoring SMS performance. This chart is relevant to the Safety Assurance (SA) portion of the Four Pillars of aviation safety. This is because safety assurance processes monitor operational systems. During the system monitoring processes by employees, stakeholders, and QA teams, these users ensure that safety data is collected and pushed through the risk management processes. All safety items are managed appropriately to assess risk and apply mitigation strategies when necessary. Otherwise, the system returns to the "monitoring phase."
Because this chart can be filtered by proactive and audit issues, this risk management chart also addresses the requirements for SMS compliance. Taken one step further, the organizational goals and objectives may have the lofty ideal for moving the organization from a purely reactive safety culture to a proactive safety culture.
Related Aviation Proactive Safety Culture Articles
- 5 Indicators of Reactive or Proactive Safety Culture in Your Aviation SMS
- 7 Great Incentives for Proactive Risk Management in Aviation SMS
- Checklist for Proactive Safety Culture in Aviation SMS Programs [With Free Resources]
Who Should Care About This Performance Monitoring Chart?
Mainly, aviation safety management and operational department heads should be very concerned with this chart. For one, it is a direct reflection of how efficient they are:
- Training employees in hazard identification strategies;
- Promoting the SMS to encourage safety reporting;
- Investigating safety issues in a timely manner;
- Documenting risk management activities; and
- Closing issues.
If an organization is beset by MANY open safety issues, then the department head(s) or safety manager(s) in charge of the division(s) are not properly managing safety issues. The accountable executive should be very concerned, as should the director of safety
Related Performance Monitoring Charts

Two other aviation SMS risk management tools couple very nicely with this chart. One chart displays activity from the safety reporting system, while the second chart pulls data directly from the risk management system and measures the effectiveness of the organization's risk management processes.
The first safety chart (at the right) is the "# Reported Issues Chart." This chart gives safety management teams an idea of how many reported issues have been submitted in the recent past.
This chart provides safety management with an added “reference point” for assessing whether the number of open issues is acceptable when you are reviewing the "Open Issues By Division" chart. When safety teams have both of these charts within a single dashboard, an effective display layout is to have these charts side by side for easy reference.

The second chart is the On-time Task Completion Last 30 Days. This chart tells safety management teams how many issues were closed on time within the last 30 days out of the total number of issues.
Alternatively, one can see how effective the organization is in completing assigned corrective actions and preventive actions (CPAs) for reported safety issues. Depending on your risk management processes, your organization may find more value in evaluating the responsiveness of closing CPAs on time versus closing safety issues on time. What is the difference?
Reported safety issues may have one or more corrective and preventive actions. I've seen as many as 25 to 30 CPAs for a single reported safety issue. Depending on your organization, you may have different processes for closing out safety issues. Some companies will allow any safety manager to close reported safety issues, while other companies require that all safety issues be reviewed by a safety committee before closing out the issue. In the latter case, evaluating the performance of organizational risk management processes may be more representative of organizational performance by focusing on CPA completion rates versus safety issue closure rates.
Related Aviation Risk Management Articles
- 4 Pillars | What Is Safety Risk Management?
- 4 Elements of Safety Risk Management (SRM)
- What Is the Process of Risk Management in Aviation SMS
Final Thoughts
SMS performance monitoring charts are critical for account executives to have some assurance that the aviation SMS is properly implemented and performing in all organizational areas. Unless safety teams can measure risk management activities, no fact-based indicators are demonstrating continuous improvement, or even at a bare minimum, the existence of a functioning SMS.
Safety teams and the accountable executive benefit from SMS performance monitoring dashboard charts, such as those highlighted in this article. These managers must regularly review organizational safety performance. Dashboard charts, such as these, allow managers to respond quickly to direct mitigating actions whenever substandard safety performance is detected.
If your aviation SMS database program does not produce real-time reports that are accessible by all managers, then you should consider getting a better solution. SMS Pro has been providing SMS database services to operators around the world since 2007.
If you are wanting to take your SMS to the next level, please review these short demo videos to learn whether we are a good fit for you.

Live SMS Pro Demo
Have questions? Want to see SMS Pro live? Sign up for a live demo.

Last updated March 2026.
