The Importance of This Risk Management Chart

If your company is like other aviation service providers, you will have a particular safety issue that keeps coming back time and again. Corrective actions may be implemented or the safety issue isn't severe enough to warrant too much attention. Your recurring safety issue may be:
- Employee fall protection not used;
- Crew-member fatigue;
- Crew not qualified for mission; or
- Ineffective substance abuse monitoring.
Is your recurring safety issue in the above list? Many of you will relate to crew-member fatigue as your top recurring safety issue. This may be due to:
- Improper crew scheduling;
- Unplanned layovers;
- Time-zone changes; or
- Long duty days.
How do you identify and document all the contributing factors that are related to your top recurring safety issues? What were the root causes? Do you know? Since this is a recurring safety issue, the root causes are obviously not being dealt with properly. How are you dealing with root causes in your risk management processes? Are they documented? Can management make fact-based decisions based on this documented information?
Related Articles on Root Cause Analysis in Aviation SMS
- How to Conduct Root Cause Analysis in Aviation SMS
- 3 Methods for Root Cause Analysis in Aviation SMS
- Proactive Risk Management: What Root Causes Say About Management
Contributing Factors Analyzed in Root Cause Analysis
Safety issues enter your risk management processes through a variety of means, but the most common element to initiate your risk management processes is a "reported safety issue" coming from the safety reporting system. During your investigations, you should be conducting a root cause analysis using a tool called the "5 Whys," "TapRoot" or something similar. The root cause analysis reviews all of the contributing factors that led up to the manifesting hazard. In the Swiss-cheese model, you will see these contributing factors as:
- Active failures or
- Latent failures.
The active failures are the unsafe actions that lead to the event. For latent failures, the Swiss-cheese model is represented by:
- Preconditions for unsafe actions;
- Unsafe supervision; and
- Organizational influences.
Once you identify your causal factors (contributing factors), your risk management process should include a review of each contributing factor. A best practice is to use a template that affords a repeatable, documented process to conduct the root cause analysis. This is one of the benefits of using SMS database software, as it makes the documentation process much simpler than if you were using paper or a spreadsheet SMS.
During the root cause analysis, your safety team should review the following areas:
- Management responsibility;
- Procedures;
- Risk Controls;
- Process management; and
- Interfaces.
Accessing Root Cause Information for Effective Risk Management

Another benefit of using an SMS database to store all root cause analysis activities is the automated generation of charts and graphs for real-time decision-making processes. Investigation data is stored in the centralized SMS database that feeds management's safety performance monitoring tools.
These tools include:
- Risk analysis charts;
- Safety trend analytics;
- KPI and safety goals monitoring;
- Historical risk exposure analytics; and
- Real-time SMS performance monitoring dashboards.
Providing management an easy way to monitor contributing factors increases the chances that managers will more quickly determine how to address the true root cause of your top recurring safety issues. A simple dashboard chart will prove very effective in addressing this business case of managing recurring safety issues.
It is not always the most severe safety issues that suck up safety teams' limited resources. Your organization may have one or two minor, recurring safety issues that consume inordinate amounts of the safety budget, whether you measure your safety budget in:
- management's billable hours; or
- accrued expenses of applying ineffective corrective actions and/or preventive actions.
Related Aviation Safety Chart Articles
- Understanding "Root Cause Analysis" Charts in Aviation SMS Dashboards
- How to Monitor Aviation SMS Performance - Safety Chart
- SMS Chart: Where to Focus Hazard Identification Training & Risk Mitigation
Uncovering Top Contributing Factors to Safety Issues
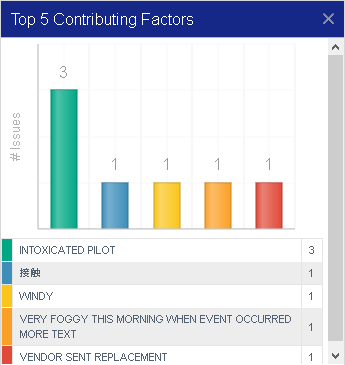
In the remainder of this article, we will take a look at the Top 5 Contributing Factors performance monitoring chart, which shows us the top 5 contributing factors that are associated with submitted safety issues in an aviation safety management system (SMS).
Unless you have an easy way to identify causal factors during investigations, charts such as these are beyond your reach. For those who have English as a second language, contributing factors are synonymous with causal factors.
This safety management chart is one of approximately 45 dashboard charts in SMS Pro's risk management database program. An aviation risk management solution will commonly provide insight into the contributing factors to your company's safety issues if safety managers and investigators properly follow risk management best practices.
Aviation safety management is tasked with asking why safety events occur, and the factors that elevated the consequences of the event. Contributing factors are particularly useful in aviation SMS risk management processes because:
- As the SMS implementation matures, the assessed “contributing factors” may change reflecting the most relevant areas of exposure; and
- Safety management can monitor the effectiveness of leading indicator controls based on how often those controls are contributing factors.
Keeping careful tabs on this chart gives aviation safety managers a golden opportunity to learn what factors are influencing company exposure to risk.
What This Chart Says About Your Safety Program

Aviation SMS contributing factors provide keen insight into an SMS risk control performance. More specifically, this chart demonstrates which factors are impeding optimal safety performance.
For example, in our Top 5 Contributing Factors at the right, "Intoxicated Pilot" outweighs all other contributing factors. If this were a real-world scenario, a safety manager would need to seriously investigate current risk controls regarding substance abuse monitoring.
In a real-world scenario, you might see the following as top factors:
- Human Error;
- Unclear procedures; or
- Lack of Communication.
Many other top contributing factors are common in aviation safety management systems. But each indicates where different controls might be failing, such as:
- Lack of training;
- Lack of checklists; or
- Subpar teamwork.
Chances are that many SMS implementations will see various types of Human Factors as their top contributing factors.
Related Aviation Safety Chart Articles
- Safety Chart: How to Monitor Aviation Risk Management Priorities Using Heat Maps
- Safety Chart: How to Monitor Overall Risk Exposure of Aviation SMS
- Safety Chart: How to Find Bureaucratic Weakness in Business Processes - Aviation SMS
Things to Watch Out For
There are three things to keep an eye on with this chart, for better and worse:
- One type of contributing factor may grossly outweigh the rest;
- One type of contributing factor has always been the top factor; and
- The top factors slowly change over time.
Ideally as your aviation SMS implementation matures, you will see the top aviation SMS contributing factors change – you might call this a symptom of growing pains. As said, this is because as your SMS matures and risk controls are implemented, the safety program will become exposed to different factors that the organization's risk management t processes have not yet had an opportunity to process.
When you see one contributing factor grossly outweighing the rest, or if your contributing factor always remains the same, then something is amiss with your risk controls. For example, if lack of communication is always at or near the top of your list then you have a serious question to consider:
- Are the pertinent controls being properly implemented (such as team building exercises)?
- Why aren’t the pertinent controls working (are there deeper underlying causes)?
Where Does This Data Come From?
Contributing factors are tabulated when safety managers or investigators are managing safety issues or conducting investigations. This is a trivial task when you have a modern aviation safety database program.
As an example, consider an investigator listing out all the contributing factors (a.k.a. causal factors). For each causal factor, the investigator classifies the contributing factor according to an industry-accepted, root-cause classification schema, such as TapRoot or a TapRoot variant.
How Does This Relate to Regulatory SMS Requirements?
When it comes to ICAO's four pillars of safety management systems (SMS), contributing factors are primarily a function of Safety Risk Management for a couple of reasons:
- Helps you determine whether or not you’re your risk controls are effectively addressing the casual factors; and
- Allows you to revise risk controls based on causal factors that indicate risk exposure.
Contributing factors are often an essential conclusion in aviation safety investigations, which are a part of Safety Assurance functions.
Related Aviation Safety Chart Articles
- Safety Chart: Risk Level Breakdown in Aviation SMS
- Safety Chart: How to Track Safety Reporting Performance in Aviation SMS
- Safety Chart: How Effective Is Hazard Identification Training in Aviation SMS?
Who Should Care About This Risk Analysis Chart?
Well, first and foremost, obviously line-level management who own the affected business processes should care about this performance monitoring chart. But beyond this, it depends on:
- Whether unacceptable results exists around particular safety trends; and
- Who/what is most closely associated with the reason for issues?
Contributing factors are the concern of every employee, and casual factors play a huge role in the development of a safety event. Moreover, identifying causal factors is part of proactive risk management – an important goal for any aviation SMS implementation.
Final Thought on Contributing Factors Chart
Contributing factors charts should be routinely scrutinized by managers. I'm not saying that this chart is a "must-have, go-to everyday chart," but I would certainly review it at least monthly or quarterly. Aviation service providers having real-time access to these types of charts have a competitive advantage over companies that must create these reports manually.
Aviation risk management solutions make short work of investigations and are often a useful investment. Just like other tools at your company, if you are not using them correctly, you are not capitalizing on your investment.
Contributing factors are an essential output of leading indicators. When leading indicators aren't monitored, they can often end up as contributing factors. Start proactive risk management with this free list.
Last updated March 2025.


