
Importance Monitoring Root Causes in Aviation SMS

Monitoring the performance of aviation safety management systems (SMS) is a common activity for safety managers and upper management alike. Furthermore, in every SMS, the accountable executive is responsible for directing actions to correct substandard safety performance whenever it is detected.
How is substandard safety performance detected in your organization?
How does management know which operational areas require additional risk mitigation measures?
Safety performance monitoring dashboards have become the most efficient manner for the accountable executive to regularly review organizational safety performance. Dashboard charts allow management to quickly review SMS performance and make operational adjustments as necessary by using real-time data from the SMS database.
Related Aviation SMS Database Articles
- How to Choose the Best Aviation Safety Database Software
- When to Design Your Own Aviation SMS Database
- Pros and Cons of In-House SMS Database and Off-the-Shelf-Solutions (COTS)
What Is Root Cause Analysis in Aviation SMS?
A root cause analysis is performed as a reaction to risk management processes as defined in your aviation SMS manual. The purpose of the analysis is to understand the causal factors that trigger substandard safety performance within a particular event, whether the event is an:
- accident,
- minor incident, or
- close call.
These events typically enter the SMS' risk management processes as reported safety issues; however, the triggering event may be an audit finding. The justification behind conducting the root cause analysis is to:
- improve system processes and procedures;
- mitigate risk; and
- prevent recurrence.
When conducting the root cause analysis, it is important to focus on the "system" and the system's related processes. Try not to attribute blame to employees involved in the reported safety event. What we are trying to uncover is
- which risk controls are failing; or
- whether adequate risk controls are in place.
Preventing the next event or "The Accident" is the objective in a root cause analysis. Root cause analyses are typically conducted on the more severe, high-risk events. This is NOT a best practice.
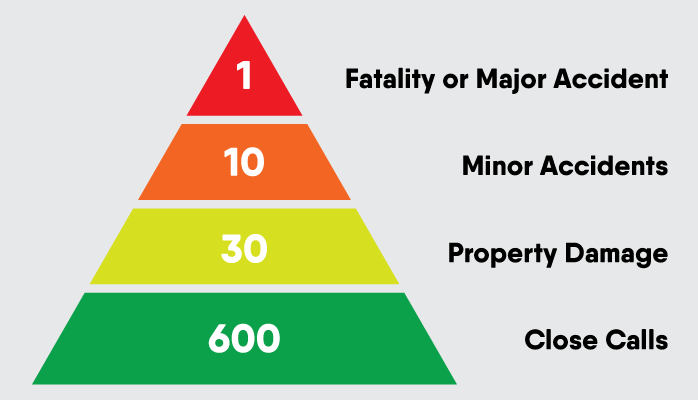
In aviation SMS, there is a popular concept that is taught in many SMS courses that demonstrates the importance of treating minor incidents and close calls just as diligently as one would treat a fatality or major accident.
You may have seen the Heinrich accident triangle or pyramid at the right. The essence of what this triangle represents is that for every major accident, there are 600 minor incidents or close calls that, if treated, would have prevented the major accident.
This is not to say that you will have 600 chances to fix something or shore up your risk controls before a major accident visits your company. The major accident could be the first, fifth, 100th, or 600th event.
What is important is that you have 600 potential opportunities to identify the factors contributing to the major accident. Even if the number were 50 or 100 minor events or close calls, this would theoretically provide your investigation team ample opportunity to identify contributing factors that lead to "The Accident."
The takeaway? The root cause CAN be identified before serious injury or damage results if you conduct a root cause analysis on every reported safety issue, and not only on the high-risk events.
Related Articles on Root Cause Analysis in Aviation SMS
- How to Conduct Root Cause Analysis in Aviation SMS
- 3 Methods for Root Cause Analysis in SMS
- Is Root Cause Analysis Proactive or Reactive?
Extent of Root Cause Analysis in SMS Investigations
The root cause analysis is a deep dive into discovering what really happened and why. When conducting the analysis, the investigation team should be consider: the
- Management responsibility: Organization or person who determines the course of action for a process, who owns the process, and who is accountable for the quality of the process;
- Procedures: Documented or prescribed methods of accomplishing processes;
- Risk Controls: Checks or restraints that are designed into a process to ensure that a desired result is achieved;
- Process Management: Measures or information assessments to identify, analyze, and document potential problems with a process; and
- Interfaces: Interactions between independent processes.

Using Sequence of Events in Analysis
Listing a sequence of events is useful when conducting the root cause analysis as the sequence of events will shed light on:
- What happened to trigger the event?
- Why did this event happen?
- How do we keep it from happening again? and possibly,
- How can we detect the root cause in the future before the event occurs?
Determining the root cause is not always easy. There may be more than one root cause. A common practice is to list all causal factors that contributed to the event and conduct a root cause analysis on each causal factor.
The results of each root cause analysis will need to be stored for future aggregation and data analysis. Spreadsheets are not the best approach to store results from root cause analysis because the data collection and storage processes will become impossible to sustain for:
- real time report generation;
- efficiently communicating results or problem areas to management in a timely manner; and
- repeatable, trend analysis.
Related Articles on Trend Analysis in Aviation SMS
- How to Use Trending Charts in Aviation SMS
- How to Prepare Data for Trend Analysis in Risk Management Programs
- Six Steps How to Perform Trend Analysis in Aviation SMS
Data Management Considerations for Root Cause Analysis in Aviation SMS
Root cause analyses commonly involve considerable amounts of related accident investigation data. Successful safety teams need an efficient data management strategy to keep root cause analysis results organized and easily accessible to generate reports that facilitate fact-based decision-making processes.
An SMS database handles the data management activities behind the scenes, which is a real life-saver for accident investigators. Not only will the database help with data storage and retrieval, but the SMS database helps accident investigators ask the right questions.
An accident investigation may uncover four to six separate causal factors related to each reported safety issue. In this case, safety teams will attempt to determine the root cause analysis for each of the causal factors. A user-friendly, repeatable process is required to consistently perform the root cause analysis. The SMS database provides operators with:
- risk management workflows to conduct the root cause analysis for each causal factor;
- data structure to store results from each root cause analysis; and
- real-time dashboard reports for management to monitor SMS performance based on root cause findings.
The main reason that safety teams do not conduct root cause analysis on minor incidents and close calls is that they lack:
- tools to easily perform the analysis; or
- processes to easily perform the analysis;
- tools to aggregate results and to communicate results to management; or
- ability to do anything useful with the results.
We have learned the benefits of conducting a root cause analysis on all minor incidents and close calls. By analyzing the root cause of minor incidents, the root cause of "The Accident" could be identified before "The Accident" occurs. Isn't this the objective of aviation SMS? To stop "The Accident?" Root cause analysis allows management to monitor operational hazards and to ensure risk controls are effective. These minor incidents are "practice" sessions for the safety team to review risk controls and to make the system better, i.e., more resilient to withstand adverse environmental influences.
To maintain the most effective SMS possible, you should be conducting root cause analyses on every reported safety issue. To do this, you will need SMS database software that makes this process very simple. In addition, your SMS software must be able to present managerial reports to facilitate fact-based decision-making.
Related Aviation SMS Software Articles
- How to Choose Aviation SMS Software - Educating SMS Professionals
- 20 Benefits of Aviation SMS Software
- Spreadsheets vs Software for Aviation Safety Management

SMS Performance Monitoring Dashboards and Root Cause Analysis

Up until now, we have outlined how safety teams and accountable executives can easily monitor SMS performance using dashboard charts displaying SMS data in real time. We have also discussed at a high level the risk management process behind conducting a root cause analysis and storing data in the SMS database for each reported safety issue.
The purpose of dashboard charts is not to look at the fine details (the trees in the forest) but to see the system as a whole to detect any anomalies that may spring up by looking at the big picture (the forest). A popular dashboard chart that every company should have is the "Top 5 Root Causes" dashboard chart.
In the remainder of this article, we will take a look at a Root Causes chart, such as the one illustrated at the right. This chart shows management the top 5 root causes that are associated with submitted safety issues in your SMS database.
By now, you will realize that an SMS database is a preferred technology to display real-time dashboard charts. A database organizes data in a secure manner and allows operators to aggregate SMS data to be used in reporting processes.
This risk management chart is one of approximately 45 dashboard charts in the SMS Pro risk management database. If you don't have this chart in your SMS database, it is relatively easy to create if you have access to your database and have a Web-based dashboard.
An SMS database will easily provide insight into the root causes of your safety issues if safety managers and investigators consistently follow accepted best practices. These best practices are determined predominantly by the tools available to the safety team. If you don't have a good SMS data management strategy, you will be wasting a whole bunch of time. Otherwise, garbage in garbage out.
Questions that should be asked sooner than later are:
- Which issues require a root cause analysis?
- Who will perform the analysis?
- What do we do with this data once we have "a lot of it?"
- How often do we look for trends related to root cause activities?
- Who will be analyzing root cause data for trends? Safety committee? All operational department heads?
On the surface, root causes are understood as the contributing factors of whatever safety issue they are associated with. Management is tasked with asking why this happened, why it happened, etc. until they have arrived at what they feel to be the main cause of an issue.
As we have demonstrated above, conducting a root cause analysis on every safety issue should be a part of your risk management process. If you have the proper tools, this is not a difficult task. Not having the proper tools is what makes root cause analysis difficult to perform in daily risk management processes.
Related Aviation Risk Management Process Articles
- What Is the Process of Risk Management in Aviation SMS
- What Are Important Factors of Aviation Risk Management Process
- How to Optimize Risk Management Processes for Aviation SMS

Why Root Causes Charts Are Important in Aviation Risk Management
Let's expand our scope. A root cause analysis has been performed on many reported safety issues in your SMS database. What do you do with this data? The first step is to aggregate the data to determine the organization's pain points. The "Top 5 Root Causes" chart demonstrates the top 5 reasons events are occurring within the operating environment.
Aggregating and displaying the most common occurring root causes is important for a couple of reasons:
- Management can detect trends in core organizational problems
- You can also filter root causes by your Key Performance Indicators (KPIs), which allows you to hone in with greater detail on core issues most important to your company
A "Top Root Causes" dashboard chart is an extremely valuable report, but certainly not one that needs to be monitored on a daily basis. Yet you don't want to ignore it.
Keeping careful tabs on this chart gives aviation safety managers a golden opportunity to address the real reasons your company is constantly exposed to uncontrolled risk, as opposed to simply dealing with the “symptoms” of reported safety issues. The difference between “reasons” and “symptoms” is the same difference between proactive and reactive safety cultures.

What This Chart REALLY Says About Your Safety Program
Root causes provide keen insight into SMS performance, or more specifically, the consistent “hiccups” that impede optimal performance. But let’s take it a little deeper than that. When it comes right down to it, root causes are subjective.
For example, with a mechanical failure, it is the responsibility of management to ultimately decide whether that mechanical failure’s root cause was truly an unavoidable mechanical malfunction, or whether the root cause was procedural that drifted into failure (such as with Alaska Airlines Flight 261), or whether the root cause was a Human Factor error.
The truth is that root causes, in addition to often having significant gray areas, can essentially "dive into exhaustive analytical depths" as long as the manager wants to continue asking “and why did this happen?”
What I am getting at here is that in addition to providing insight into real reasons for unintended events, they also shed valuable light on the root causes that your organization ultimately holds to be most important at a certain point in history. This is because organizations will tend to reach certain root causes and feel that they have arrived at the “right” one.
In this manner, the root causes chart not only tells you about significant recurring organization problems but also the: root concerns and attitudes of management. Now we are using this chart to discover what is important to our safety culture. After all, management attitudes drive safety culture.
I’m curious to see how aviation managers weigh in on this point – please leave comments below! What do your root cause charts tell you about your safety culture? Are they biased?
Related Aviation Safety Culture Articles
- How to Re-Engineer Your Aviation Safety Culture?
- 3 Reasons Why Aviation Safety Culture Leads Directly to Safety Performance
- 4 Unlikely Indicators of Unhealthy Aviation Safety Culture - With Downloads
Things to Watch Out For
Significant concerns with this aggregated chart may be seen as a double-edged sword.
On the one hand, having a significantly high number of reported safety issues for a particular root cause may be a troubling sign of a serious deficiency in the "system design" or with management priorities. For example, if in your top 5 root causes, Communication is associated with 40 KPI issues, and the second-highest root cause is only associated with 20 issues, then your organization may have a serious communication problem.
However, I say “MAY be a troubling sign” as opposed to “IS a troubling sign” because significant trends in these risk management charts also may reflect a root concern of your organization.
When identifying root causes, it’s always helpful to review some of the related safety issues with a fresh set of eyes to determine if the original root cause assessment still seems to be the most likely cause. Such reviews can help ensure that the root cause trends are indeed performance-related as opposed to “assessment” related.
Where Does This Data Come From?
Root causes are identified and documented when safety managers or investigators classify issues or conduct in-depth safety investigations. This becomes a trivial task when you have modern aviation SMS database software that includes root cause investigation features.
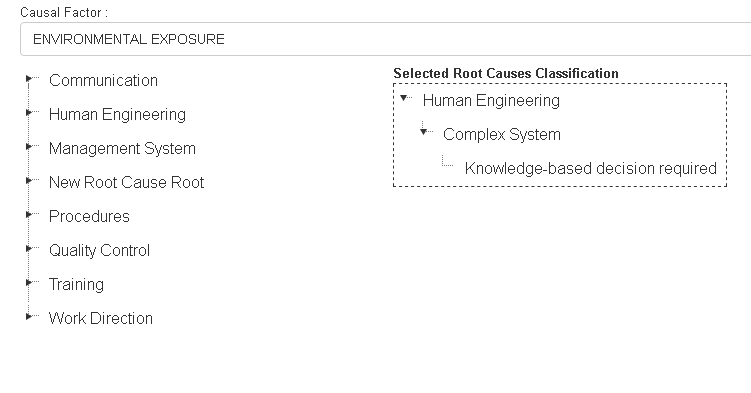
As an example, consider an investigator listing out all the contributing factors (a.k.a. causal factors). For each causal factor, the investigator classifies the contributing factor according to an industry-accepted classification schema, such as a tap-root classification schema or a variant.
Below is an example from the SMS Pro database in the investigation module. You can infer that there are drag-and-drop features from the root cause classification schema on the left. When a manager drags a root cause from the left, the database stores the result, which is used when creating the "Top 5 Root Causes" chart.
How Does This Relate to Regulatory SMS Requirements?
When it comes to ICAO's four SMS pillars, root causes are primarily a function of both Safety Risk Management (SRM) and Safety Assurance (SA) for a couple of reasons:
- Help you determine whether root cause trends are within an acceptable range of “risk” (SA)
- Allows you to revise risk controls based on root cause trends indicating vulnerabilities (SRM)
Moreover, this aggregated Root Causes chart serves an additional Safety Assurance function by providing management awareness of the effectiveness of policies/procedures curtailing dangerous trends relating to identified root causes.
Related Safety Assurance Articles
- 4 Pillars | What Safety Assurance Really Means in Aviation SMS
- Best Tip for Safety Assurance Monitoring in Aviation SMS
- 40 Questions for Your Safety Assurance Process in Aviation SMS [With Free Checklists]
Who Should Care About This Risk Analysis Chart?
Well, first and foremost, obviously management should care about this chart. But beyond this, it depends on:
- Whether unacceptable results exist around a particular root cause trend
- Who/what is most closely associated with reported safety issues behind an unacceptable trend
For example, if an inordinate number of safety issues are associated with employees in a division not completing procedures as prescribed, then the employees who are not following procedure should be very concerned, as well as the managers of that division. Or if equipment failure is consistently a root cause, then both the manufacturer as well as managers in charge of buying equipment should be concerned.
Final Thought on Root Cause Charts
Root cause charts should be routinely scrutinized by managers. Aviation service providers having real-time access to these types of charts have a competitive advantage over companies that must create these reports manually.
Aviation SMS databases make short work of root cause investigations and are often a useful investment. Just like other tools at your company, if you are not using them correctly, you are not capitalizing on your investment.
SMS Pro has very well-developed, industry-accepted accident investigation tools that make root cause analysis activities sustainable over a prolonged period of time. Furthermore, user-configurable SMS performance monitoring dashboards allow management to monitor salient operational challenges facing your company.
If you are unable to easily perform and document a root cause analysis in your SMS, you are missing out on a very big opportunity to reduce risk to as low as reasonably practical (ALARP). We can help.
If you are unable to easily document a root cause analysis activity, then you will be less likely to perform a root cause analysis on every minor incident or close call. This is a risk!
These short videos explain the benefits your company will realize by using a low-cost, commercially available SMS database to manage SMS data.

Live SMS Pro Demo
Does it look like we are a good fit? Have questions? Want to see SMS Pro live? Sign up for a live demo.

Last updated May 2026.
