What Is a Fishbone Diagram?
Fishbone diagrams are perhaps the best risk management tool in aviation safety management systems (SMS) for gaining a comprehensive understanding of root causes of safety incidents.
A fishbone diagram derives its name from its fishlike appearance, with a head of several fins.
Each “fin” or “branch” of a fishbone diagram describes a different category of the situation, such as the categories “Human” or “Machine.” The head of the fishbone describes the risk.
Fishbone diagrams are also known as cause-and-effect diagrams or Ishikawa diagrams. In real-world environments, they are used for three purposes:
- Understand the causes and effects that lead to risks and undesirable events;
- Explore root causes of a safety issue; and
- Understand the relationship between causes and effects.
Related Articles on Root Cause in Aviation SMS
- How to Conduct Root Cause Analysis in Aviation SMS
- Understanding "Root Cause Analysis" Charts in Aviation SMS Dashboards
- Proactive Risk Management: What Root Causes Say about Management
Unlike a risk matrix, the fishbone diagram does not display any “subjective” elements such as likelihood or severity. Rather, it’s merely an objective way to understand root causes and subsequent events.
Also, fish diagrams are not concerned with the events that come after a risk, just simply the factors leading up to the risk. To create fishbone diagrams, it’s essential that you understand exactly what a risk is.
Our Fishbone Diagram Scenario
We will be using the same scenario that we used in the article for How to Do Bowtie Analysis. Here are the details:
- An Airbus nearly collides with a Boeing 747 as it is taking off;
- The Airbus passed directly overhead the 747, with an altitude of only 200 feet (~67 meters);
- Most passengers on the 747 witnessed the near collision;
- The incident occurred at night;
- The Airbus was cleared for takeoff, but the 747 had been in breach of its taxi clearance and had moved on to the runway;
- The 747 flight crew did not hear the Airbus being given takeoff clearance;
- The 747 acknowledged the hold short clearance but did not clearly see the hold short line and had a hard time seeing it because of glaring runway lights. Also, the hold short line was not shown on the airport diagram;
- Moreover, the ASDE-X warning was noticed too late to stop the 747 from breaching;
- In the ensuing months, the situation resulted in lost revenue, lost stock value, bad press, and fines for the 747 airline company.
We will create the fishbone from the perspective of the 747 airline company.
Establish Framework and Add Fins
The framework of a fishbone diagram is the category that will become “fins” in the fishbone diagram. These categories will be how you break up the issue into different parts for analysis. The framework you choose for your fishbone diagram is extremely important because it will affect:
- The perspective from which you assess situations;
- The structure of all fishbone diagrams; and
- How do you understand the role of root causes in safety events?
Some examples of different frameworks you can use are:
- 5-M model;
- SHELL model; or
- Your custom model.
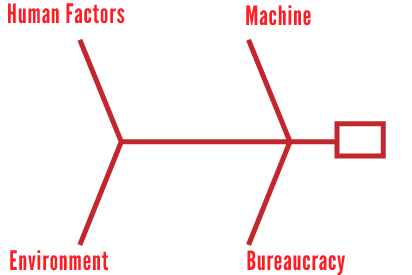
While you can create a different framework for each fishbone, we recommend that you keep it consistent as much as possible. For our example, we will use a custom framework with 4 categories, as seen in the picture:
Related Aviation Risk Management Articles
- Difference Between Hazards, Risks & Control Measures in Aviation SMS
- Going From Reactive to Predictive Risk Management in Aviation SMS
- How to Practice Reactive, Proactive, and Predictive Risk Management in Aviation SMS
Choose Risk and Add as Head
With our framework in place, we need to establish what the risk of the situation is. The risk is the “problem statement” of the situation and will be placed at the head of the fish. Remember that risk is the point when safety control is lost. The three candidates aviation professionals would probably point to for the risk in our situation are:
- The near-miss;
- The aircraft being stuck on the runway; and
- The runway incursion.
The correct risk is the runway incursion because the moment the plane crosses the runway is the moment safety control is lost and requires an immediate response. It is also our problem statement because in the future it is the problem we would like to avoid.
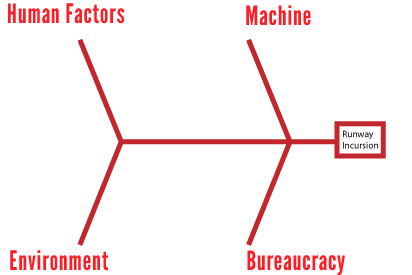 So we can now add “runway incursion” to the head of our fishbone diagram. At this point, we can ignore any details that came after the runway incursion because fishbone diagrams are only concerned with the risk and preceding events.
Figure Out Causes With “Why” Questions
Now that we have our risk, the first process we need to do is:
- For each category, ask “Why” it contributed to the risk;
- List 1-4 possible causes; and
- Create smaller branches on fins.
For example, let’s look at Human Factors category of my fishbone diagram. The primary causes here are:
- Distraction;
- Miscommunication; and
- Lack of awareness.
I would then draw three smaller horizontal lines on the Human Factors fin, and write in my 3 causes.
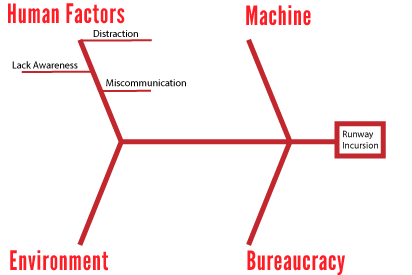 I would then move on to the next category and repeat the process. The purpose and main thing you need to realize when looking at this are that we are now looking at the “causes” that contributed to each element of the problem.
If you chose a different framework, you would have a different understanding of which causes and which elements contributed to the problem. Choose your framework carefully!
Related Articles on Root Cause in Aviation SMS
- 3 Methods for Root Cause Analysis in SMS
- Is Root Cause Analysis Proactive or Reactive?
- Safety Chart: Monitor Root Causes' Contributing Factors in Aviation SMS
Establish Root Causes With More “Why” Questions
Now, we will repeat the exact same process that we did, except now we will ask “why” did each cause happen. We should come up with 2-4 root causes for each cause.
For example, when I look at the cause of “Lack of awareness,” the two details that seem most prevalent are:
- Incautious behavior;
- Uncertain hold-short line; and
- No visual runway check.
I would draw vertical lines branching away from "the Lack of awareness" cause and then list my root cause.
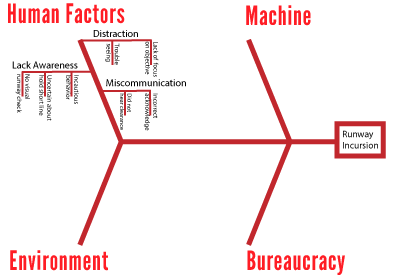
You must complete this process for each cause.
Final Thought: Hints and Tips
A couple of hints and tips that will make your fishbone diagram creation much more efficient:
- The same root cause may appear in more than one place because there can be overlap;
- It’s okay if some fins or causes have very few items – it just depends upon the situation;
- You may have to add another branch to the root cause branch if there is reason to do so – the lowest level branch will always contain the root cause;
- Bolding the most important root causes when the diagram is finished can help for future reference; and
- For complete risk management, you should pair the fishbone diagram with another risk management tool that analyzes post-risk events, such as bowtie analysis.
For other risk management benefits, you may find the following aviation risk management workflow diagrams useful:
If you want the best aviation risk management tools, then you should consider SMS Pro. Consultants and clients agree that SMS Pro is the best, most complete aviation SMS software tool on the market.
If you are needing SMS software tools, please watch these videos to learn how you can benefit.
Last updated in February 2025


