Data Mining Is the Foundation of Predictive Risk Management

Predictive risk management is one of the primary goals of an aviation safety management system (SMS). Predictive risk management allows operators to identify safety issues and spot trends before they result in a
- near-miss,
- incident, or
- accident.
Going from reactive to proactive, and finally to the predictive risk management phase in an aviation SMS takes
- many years of data collection efforts, and
- strategic data management planning on the part of an aviation safety manager and upper management.
Related Aviation Risk Management Articles
- What Is Reactive Risk Management (Why It’s Essential for Aviation SMS)
- From Reactive to Proactive Hazard Identification in Aviation SMS
- From Reactive to Proactive Risk Management in Aviation SMS
Once the aviation SMS graduates to predictive risk management processes, this does not mean the SMS will cease practicing reactive or proactive risk management strategies. After your SMS implementation matures to the predictive phase, the safety team, with the help of employees and auditors, will continue to monitor the "systems" and respond either reactively or proactively, depending on any detected anomalies within the system.
Mature SMS gradually achieves more "potential predictive capabilities" with collected data that management can use to spot trends and respond appropriately.
The ability to practice effective predictive risk management hinges on the following:
- Effective safety culture that reports most minor incidents and close calls (for a complete data set)
- Ability for employees, contractors, and customers to easily report safety concerns
- Professional aviation safety hazard register with the ability to easily classify reported safety issues
- At least two to three years of hazard identification data collection
- Cooperation between employees and management for healthy safety reporting culture
- Targeted, user-friendly classification system during risk assessment and mitigation
- Most importantly, creative data mining techniques
Without efficient data mining capabilities, effective predictive analysis activities would be impossible to carry out on a repeated basis. Data mining, along with regulatory compliance findings, is part of the reason that many aviation SMS have made the jump from manual, spreadsheet-driven SMS data management strategies to professionally designed SMS database software.
Data mining SMS requires sorting through the multiple systems that collect SMS data. There are multiple possible data sources from the SMS, including:
- Operational databases;
- Safety Reporting System;
- Risk Management System;
- Hazard Register;
- SMS Training System;
- Auditing System; and
- Safety Promotion Activities' Data Sources (surveys, safety messages).
You will obviously have some of these data sources, and probably several more that are not listed. Each organization is unique and uses different systems based on its size and operational needs.
We see a clear correlation between the rise of aviation SMS software and significant drops in aviation accidents – and a primary reason for this is the ability to, with the aid of technology, create extremely sophisticated data mining techniques.
Related Aviation SMS Software Articles
- How Does Aviation Safety Software Improve Safety? - Aviation SMS
- How to Choose Aviation SMS Software - Educating SMS Professionals
- 20 Benefits of Aviation SMS Software
Viewable End Goal of Data Mining
The ultimate use of data mining is to create fantastically, visually appealing aviation SMS tools that facilitate fact-based decision-making, like:
- Trending charts
- Pareto charts
- SMS performance monitoring charts
- Data tables
- Quantifiable relationships (map) between variables
Such tools are the intermediary between data mining activities and resulting predictive risk management activities. Data mining should always begin with a functioning tool in mind.
For example, if a safety manager is wondering which hours in employee shifts have the most reported safety issues and/or hazards, his/her data mining objective would be with the purpose of creating a data table to analyze relationships.
Or, if a safety manager is curious about the status of bird strikes, data mining analysis would probably be used for the purpose of creating a trending chart or a map indicating where the majority of bird strikes occur.
Having a viewable tool as an end goal before starting the data investigation will make the process of data mining significantly more effective. This "end goal" provides the analyst with an idea as to which data elements to collect, sort, and filter for the resulting data set that drives the "visual tool's presentation format"
Importance of Professional Hazard Register

Databases are huge – in terms of
- importance to the organization's ability to demonstrate a working SMS;
- diverse subject areas that collect data across all four SMS pillars (various systems); and
- physical size (number of records and tables).
Your organization will spend several years reactively and proactively managing
- reported safety issues,
- audit findings and
- hazard identification and safety risk analysis activities.
Most of these SMS items are run through your documented risk management processes, including
- safety reporting processes;
- managing risk assessments;
- performing investigations;
- documenting mitigating actions; and
- reviewing closed issues to ensure mitigation strategies remain effective.
In most cases, a company with more than 100 employees will have an SMS database or a group of "point solutions" to manage SMS data. The database will soon become impossible to navigate or utilize unless:
- It was initially designed with a high degree of scalability;
- The database was well organized from the beginning;
- The database can be integrated with the other SMS data collection systems; and
- The database has been managed effectively.
All of these points make one fact clear: there is no substitute for a professionally designed, industry-tested SMS database with an integrated hazard register. In-house hazard registers will become unnecessarily bloated or grow way out of hand very quickly as hazard data pours in.
Related Articles on Using Spreadsheets in Aviation SMS
- 5 Things Spreadsheets Can’t Do for Your SMS
- Spreadsheets vs Software for Aviation Safety Management
- How Spreadsheets Not EASA Compliant Aviation Safety Reporting Database
The hazard register that lives in a spreadsheet is not going to serve the company well when you get into the predictive analysis phase. Chances are that if you continue with the spreadsheet hazard register, you will never engage in predictive analytics on a continued basis. There are simply too many limitations with the disconnected hazard register spreadsheet to the reported issues' data store.
Also consider that without a database, an aviation SMS would be unable to fulfill their intended objective of efficiently spotting trends. Another way of looking at it is that an SMS is usually only as good as its hazard register and its integration with risk management data.
The hazard register is the output from the systems' design. It stores the documentation related to:
- Hazards;
- Hazard related risk consequences;
- Risk controls; and
- Management review activity.
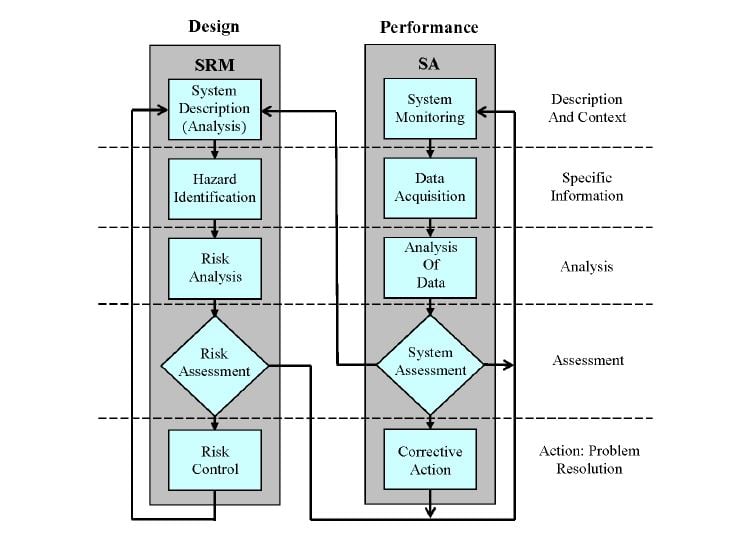
As safety assurance (SA) monitoring data enters the SMS database from reported safety issues and audit findings, safety teams need an easy way to classify this monitoring data according to the system and hazard from which it originates. For example, consider this very common model below showing the interaction of safety risk management (SRM) processes and SA's processes.

In the model above, we see reported safety issues and audit findings enter the "Performance" side of the model in the "Data Acquisition" process. As reported safety issues are analyzed, the system is reviewed (SRM) to ensure risk remains acceptable, or acceptable with mitigation.
The SRM side of this model contains the Hazard-Risk Register, while the SA side contains data related to reactive risk management processes. In real-life operations, you will also see employees proactively identifying hazards or substandard processes that appear as "reported safety issues" entering the system from the SA monitoring side but are addressed on the SRM side.
Management of change activities and proactively identified hazards are commonly processed on the SRM side. As the system design is "approved" and returned to the "monitoring state" on the "Performance" side, employees and stakeholders monitor the system to determine whether the "system design" remains sound. Otherwise, system monitoring will detect anomalies and the entire risk management process resumes.
Related Aviation Risk Management Articles
- Difference Between Reactive, Predictive and Proactive Risk Management in Aviation SMS
- 3 Ways to Practice Predictive Risk Management
- How Aviation Safety Managers Reach Predictive Analysis Phase
Classifications

Classifications are a key component of any sophisticated data mining endeavor. Shallow classification schemes will always produce superficial and ultimately ineffective hazard analysis results. The more in-depth or detailed a classification schema is, the more refined and useful will be the data mining results.
For example, consider the following three database classification schemes for bird strikes:
- Register that only has
- bird strike classification
- Register that has
- bird strike classification
- bird species
- Register that has
- bird strike classification
- bird species
- location (i.e. in the air, on the runway)
And so on. Clearly, with the hazard register schema in example #3, the SMS data analyst will be able to establish and analyze relationships in much greater detail than the hazard register schema from example #1.
Thus, detailed classification schemes allow data analysis to be incredibly more specific. The more layers of classifications, the more specific data results can be filtered and sorted. More refined search results allow for better reports and charts to be developed for trend analysis, for example.
Part of having a deep classification system is contingent upon a hazard register that allows for sophisticated classifications, but it also depends on the safety manager taking the time to classify reported safety issues and audit findings appropriately.
Thus, we can consider creating deep classifications as a premeditated ethic on the part of the aviation safety manager.
Detailed classification schemes can be a good thing to help create the best quality analytical charts. However, there is a problem we see when classification schemes are abused by overzealous safety managers. More is not always better.
Some cultures believe that the more complicated the system design, the system will perform better. The system will have more utility or credibility. We see some managers that develop very deep classification trees that are five, six, or even eight levels deep. The problem becomes quickly evident when a larger group uses the classification schemes. The larger the group using the classification schemes, the less consistency in classifying reported safety issues and audit findings.
The European Union is trying to recover from this bad practice regarding the ADREP taxonomy that commonly exceeds five levels, such as:
- Classification;
- Sub Classification;
- Sub-Sub Classification
- Sub-Sub-Sub Classification; and
- Sub-Sub-Sub-Sub Classification.
The problem with these deep trees is that it becomes very difficult to "quickly" find a particular classification element. A best practice is to limit your classification schemes to three or four levels, with three levels being the optimal level. There is nothing more frustrating and time-consuming for safety managers than redesigning their classification schemes. Redesigning the classification scheme is the easy part. The challenge comes from the historical, legacy data that had been previously classified with the outdated classification schema. Manually reclassifying thousands of safety concerns is time-consuming and a brutal task.
Another best practice for your classification schemes is to limit the number of employees who can modify these classification schemes. Not all employees understand the logic behind simple and easy-to-use classification schemes. Nor do they think of the ultimate objective of these classifications and how they relate to predictive analytics.
Have You Read
- How to Set Up Classifications in Aviation SMS
- 4 I’s of the Issue Management Life Cycle in Aviation SMS
- What Is Modern Aviation Risk Management Cycle - With SMS Resources
Association Clustering

Cluster graphs are one of the most effective tools generated from data mining activities. Cluster graphs allow safety officers to establish clear relationships between hazards, risks, and other data points, such as location data.
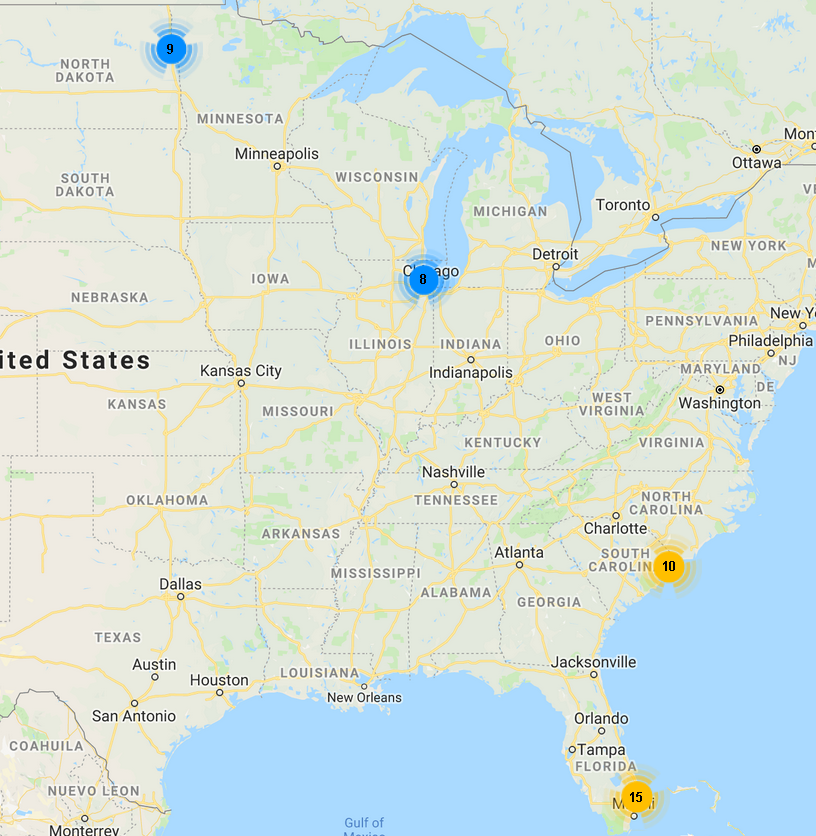
A cluster graph is simply a graph, with one variable on the Y-axis and one variable on the X-axis, and each piece of data marked on the graph, such as a map. A cluster develops when many data points exist in close proximity to each other.
For example, continuing our example of bird strikes, a safety manager might see high clusters of bird strikes in certain months and particular locations. He/she could deduce the reason for this has to do with the migratory patterns of birds.
Moreover, if classified thoughtfully, the safety manager could data mine to create a cluster graph that shows which time of year certain species pose the greatest risk, where (i.e. air/ground), and where they pose a safety risk.
Finding high correlative relationships between two elements is the foundation of predictive risk management. It’s a necessary stepping stone for extrapolating that data into sophisticated trending charts and predictive risk management policies.
Sequential Patterns Hazard Trees

Using sequential patterns to create hazard trees is a powerful data mining technique that is extremely useful for establishing root causes in an aviation SMS.
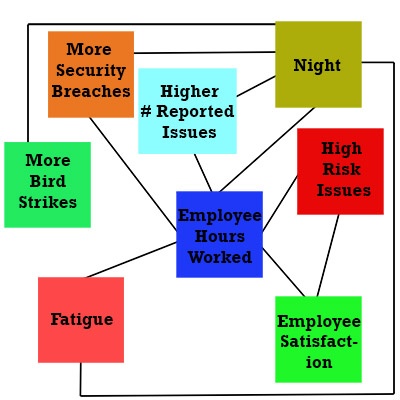
Sequential patterns are the process of analyzing “triggers” for issues, that in turn may trigger more issues. A safety manager might start by data mining for a general risk, such as “nighttime” issues. Then he/she would ask yes or no questions about whether that risk correlates with other issues/risks – if the answer is yes, that safety manager would draw a line between the two.
When data mining with this method, the natural result is a sort of tree, web, or related hazards. An example might look like the diagram to the right.
Though this is a simplified and rather obvious example, it clearly shows how this data mining method can be used to establish root causes. In the example to the right, we can easily establish that Employee Hours Worked is a root cause for many issues. We also see that nighttime is another root cause for issues and risks.
Related Aviation SMS Root Cause Analysis Articles
- How to Conduct Root Cause Analysis in Aviation SMS
- Is Root Cause Analysis Proactive or Reactive?
- Understanding "Root Cause Analysis" Charts in Aviation SMS Dashboards
Final Thought
Data mining should be looked at as the foundation for predictive analytics.
As an aviation SMS hazard register grows, the onus is on the safety manager to develop more sophisticated data mining techniques. The process of creating more refined data mining techniques is also the process by which SMS transitions towards predictive risk management.
A common SMS data management challenge exists that frustrates safety teams around the world. This challenge also delays an organization's participation in the predictive analysis phase by two to five years.
A typical scenario unfolds similar to this simplified workflow:
- Organization decides to implement SMS;
- Organization learns about SMS requirements and starts to collect tools to manage SMS(different systems such as safety reporting, auditing, hazard register, training, etc);
- Organization adopts spreadsheet to manage different parts of the SMS' data;
- Organization graduates to one or more "point solutions" to manage particular aspects of the SMS, such as isolated:
- safety reporting system;
- auditing system; and/or
- training management system.
- Organization realizes that data is "all over the place" when faced with compliance audits
- Organization tries to fix broken SMS data management system for two to four years
- Organization realizes that commercial SMS database software reduces risk and has the desired functionality.
I've seen this same workflow play out repeatedly over the past dozen years. When operators look for SMS database software, cheaper does not mean better. Also, being cheaper does not mean that the system will address regulatory compliance standards.
The outlined, abbreviated workflow above is not the same for every operator, as the very small and the very large operators don't fit this pattern. The tragedy is that safety managers are not data management professionals and they "don't know what they don't know" in the early years of the SMS implementation. It was only after a few years of practicing SMS that they came to realize that their SMS data management strategy was short-sighted.
They did not plan for the predictive analysis phase.
They may have not known how to practice predictive risk analytics.
Now the safety team may have been collecting data for several years and realize that they cannot easily generate reports for identifying trends. This is the reason safety teams waste several years before having the correct data management strategy that facilitates predictive analytics.
If you are in this situation and need tools to capture data and classify it for future predictive risk management activities, we can help. Please watch these short demo videos to learn how you can benefit from a low-cost, commercially available SMS database software solution that has predictive analytics built into the software.
Live SMS Pro Demo
Have questions? Would you like to see a live demo? Sign up below.
Last updated August 2025.


