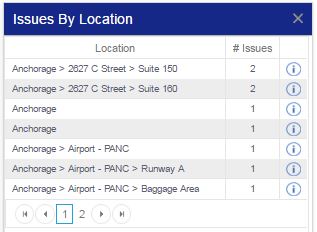
Why the Issues by Location Chart Is Important

In aviation safety management systems (SMS), locations are often underutilized and neglected detail when reporting or managing safety issues, because modern aviation safety databases can't trend this data effectively.
Furthermore, it’s simply easy to gloss over such details as – what difference does it make? In truth, adding such detail could make no difference to ongoing continuous improvement as risk controls are implemented that should be location agnostic. On the other hand, it could clarify glaring safety risks in your operating environment that would otherwise go unnoticed.
Related Aviation SMS Performance Monitoring Chart Articles
- Safety Chart: How to Monitor Overall Risk Exposure of Aviation SMS
- Safety Chart: How to Monitor Aviation SMS Task Performance
- Safety Chart: Visually Presenting Aviation SMS KPIs - With Free KPI Resources
The greatest benefits of a chart like the one at the right are:
- It shows locations in your organization that are vulnerable to hazards; and
- It provides the kind of specific data that could prove useful in unexpected ways, depending on your role in the aviation SMS.
In the report, we see locations structured and organized in a tree format that moves from general locations to more specific locations. For example; Anchorage Airport → C Gates → Gate C3 → Loading Ramp. And so on.
Such an organizational structure of locations will give you all the data needed to identify significant location trends. For example, you might identify several issues located at gate C3, or on C3’s loading ramp. Having a chart that lists the top 5 locations makes identifying trouble spots as quickly as possible.
Situations When This Chart Is Very Useful
This chart is useful in several situations. An important part of reviewing the effectiveness of safety policies or procedures is the effectiveness of interactions between different employee groups. Interactions are important because successful interactions necessitate effective communication.
In a systematized industry such as the aviation industry, interactions will often happen at the same locations, and breakdowns in communication at these interactions “checkpoints” can result in detected (and subsequently reported) safety issues.
Thus, the Issues by Location Chart is useful for reviewing procedures' effectiveness for facilitating quality communication and interactions. A natural result of this chart is that you can create a visual map for your aviation SMS' vulnerabilities. If you were to put issue locations onto a map, you would have a second opportunity to see themes.
What This Chart Reveals About Your Aviation SMS Program

Through either using the Issue by Location chart or by mapping the locations, this chart will reveal several important things about your SMS:
- Unforeseen connection between physical environment and risk;
- Unforeseen breakdown in accountabilities;
- Indicates where procedures may need to be updated;
- Highlights operational areas where employees require more training; or
- Illustrates possible absences of safety reporting in certain expected areas of operations.
If patterns are identified in with the Issues by Location Chart, it could be a product of:
- One employee not maintaining accountabilities;
- A breakdown in communication between employees due to poor working relationships, or lack of quality procedures;
- Hazards in the physical environment that have not been accounted for; or
- Environment is changing and risk controls are no longer effective.
Either way, if any safety issues have been reported in close proximity to each other, a safety manager or department head will hopefully be able to quickly assess the root cause of the issues.
Related Aviation SMS Performance Monitoring Chart Articles
- Safety Chart: Monitor Aviation SMS Performance With Leading Indicators
- Safety Chart: Risk Level Breakdown in Aviation SMS
- SMS Chart: Where to Focus Hazard Identification Training & Risk Mitigation
How Issue by Location Charts Are Created
This chart can be created in an unsophisticated aviation SMS data management spreadsheet or with a professional SMS database in one of two ways:
- During submitting or managing safety issues, the reporter will list a specific location associated with the reported safety issue; or
- While the safety issue is undergoing the prescribed risk management process, the safety manager may add the location when deemed important or relevant.
In less sophisticated SMS data management scenarios, such as those using MS Excel spreadsheets, you will simply need to filter your results and manually tabulate the data. In aviation SMS software, this information will automatically tabulate in real-time whenever users with the appropriate permissions access the report. Either way, acquiring the data for an Issue by Location chart is straightforward.
How This Chart Relates to SMS Requirements

Indirectly, this chart relates very closely to Safety Policy and Safety Assurance in the Aviation SMS Four Pillars.
- In terms of policy, as discussed, this chart sheds light on breakdowns in procedures that do not properly account for hazards in the environment and/or lead to inferior interactions (failed risk controls); and
- In terms of Safety Assurance, this chart is a subtle but effective way to support the identification of new hazards and reveals substandard existing risk control strategies.
- Again supporting Safety Assurance, this report substantiates active system monitoring and active hazard identification activities.
- As Accountable Executives are responsible for regularly monitoring SMS performance, this chart supports the fulfillment of this requirement.
- Accountable Executives are responsible for ensuring the aviation SMS is implemented and operational in all organizational areas. When this chart repeatedly fails to represent a particular region or division, this should warn management of possible substandard SMS performance in under-reported regions.
- Consistency of safety reporting culture can be generalized from this report. High reporting metrics at particular locations may be an indication of a more healthy reporting culture at this particular location.
Related Aviation SMS Performance Monitoring Chart Articles
- Safety Chart: Aviation Risk Management Task Delegation
- Aviation Safety Chart: Monitoring Hazard Reporting Culture Per Division
- 4 Safety Charts for Department Heads Issue Management Performance
Final Thought: Automating the Process
Aviation service providers with more than 40 employees, or those operating under EASA rules, will need a database to manage aviation SMS data requirements. Such tools are affordable and save considerable time and energy, especially when it comes to demonstrating regulatory compliance.
Being able to easily see where safety issues are affecting operations is a benefit that most modern SMS databases can provide. Over the course of the SMS' lifetime, the time and energy to manually manage just this one simple risk management metric will overwhelm a spreadsheet SMS. Safety managers in the early years of an SMS implementation are not looking forward five to ten years into the future when this location data will really become useful for predicting future events.
The predictive risk management phase is where most aviation SMS aspire to practice. However, you need historical data and the means to easily mine that data to fully capitalize on the collected SMS data. The predictive analysis phase relies upon historical operational data to predict future events. SMS implementations that neglect to capture important risk management data in the early years will certainly not have the same predictive risk management capabilities as those operators with the foresight to document their SMS risk management activities in the database.
Here is a good example of how a basic, user-friendly hazard reporting solution can benefit your company. Tracking locations and report generation is simple and makes your company appear more professional to regulatory agencies and prospective clients.
Last updated April 2025.


