Why the All Issues by Division Chart Is Important

Aviation safety dashboard charts automatically monitor and present aviation safety management systems (SMS) data to stakeholders, who can then use the information to make fact-based decisions.
Due to increased Internet reliability across the world, dashboard charts have become the most popular for aviation service providers to securely monitor SMS data in real time. The dashboard presents managers and users with visual representations of the aviation SMS' historical performance and alerts users of "noteworthy exceptions" that may require corrective action.
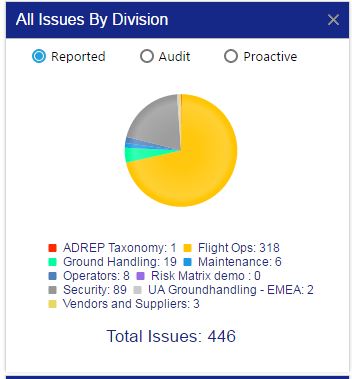
The “All Issues by Division” dashboard chart (at the right) is such a performance monitoring chart. This managerial, decision-making chart represents active participation, as well as the distribution of this participation in your SMS' safety reporting culture.
Related Aviation Safety Reporting Culture Articles
- 5 Simple Tips to Improve Aviation Safety Reporting Cultures
- Understanding Role of Hazard Identification Training and Safety Reporting Forms in Aviation SMS
- How to Monitor Aviation Safety Reporting Culture Using Safety Charts
The All Issues by Division chart allows you to see four critical elements to monitor safety reporting performance:

- Total number of reported safety issues;
- Total number of audit-related findings and concerns;
- Total number of proactively identified safety issues; and
- The number of safety issues are grouped by division to illustrate risk management activity level.
This is a real-time chart that your aviation SMS database program will automatically update as new
- safety issues are reported; or
- audit findings enter the SMS risk management process.
When a new safety issue is submitted, the division for which the safety issue was submitted will grow by one open issue. Safety managers can toggle which divisions are shown and hidden by clicking on their name below the pie chart.
The reason these numbers are a quick look at an organization's safety reporting culture is twofold.
- The number of proactive issues in relation to total issues gives aviation safety management teams an idea of how proactive their SMS' safety reporting culture is; and
- Though the total number of reported issues on this chart is “real time,” a real-world use case would tell management how often different divisions’ employees are interacting within the SMS by identifying hazards and reporting safety concerns.
What This Safety Chart Reveals About Your Aviation SMS
In so many ways, the All Issues by Division chart’s combined importance of-
- Showing reporting culture in each division and
- Showing which divisions audit issues (i.e., audit Findings) are coming from-
-reveals how efficient an aviation SMS' risk management processes are. Proactive hazard identification, efficient safety reporting processes and timely management of reported safety issues cultivate a quality, high-performing aviation safety risk management environment, which is a desirable characteristic of every aviation SMS.
Furthermore, because this chart allows users to filter open audit issues, real-world uses of this performance monitoring chart give safety managers a daily look at how compliant each division is in their SMS. As in, the more open audit issues there are, the more difficulty that division is having with the bureaucratic portion of SMS.
Related Aviation Safety Chart Articles
- SMS Chart: Where to Focus Hazard Identification Training & Risk Mitigation
- Safety Chart: How to Maintain Monthly Aviation SMS Hazard Reporting Goals
- Safety Chart: How Top Reporters Improve Aviation SMS' Safety Culture
What to Watch Out For
There are a several reasons why an aviation safety manager would want to regularly monitor the All Issues by Division chart.
- A safety manager would want to ensure that the pie chart distribution equally represents the distribution of the number of employees in each division;
- If one division has several employees with far fewer reported safety issues than might be expected, the safety manager would need to investigate further; and
- Likewise, if one division is doing a good job identifying hazards and reporting safety issues, they should be recognized.
Moreover, by keeping tabs on this chart over time, such as by taking screenshots of the chart every month, aviation safety officers can watch the fluctuations in distribution over time. The point is that with monthly checkups, any consistent trends of growing or shrinking reporting culture per division will become clear.
Where This Aviation Safety Data Comes From

The data for this chart is tabulated from a couple of separate data sources within the SMS database. The most notable place this data originates from is the list of safety reports generated from the safety reporting system. As safety issues are reported in your aviation SMS, the chart displays tabulated values based on reported safety issues for each division. This is not a perfect representation in SMS Pro's database.
All employees, contractors, and stakeholders have the ability to report safety issues to the SMS database. Depending on how safety issues enter the SMS database, the affected division may or may not be known to the user reporting the safety concern. For example, a contractor submits a safety issue to your SMS database by email. The contractor probably has little familiarity with your SMS data management structure. He may not know or care how the safety issue fits into your data schema. All the contractor is concerned with is notifying your safety management team of the potential safety concern.
Once the safety issue enters the system, the safety manager can determine where this safety issue should be treated. Does it belong to
- Flight ops;
- Maintenance;
- Engineering;
- Commercial and marketing?
The reporter doesn't care. The point I wish to highlight is that this issue may be a flight ops safety issue, but it was reported by an external party. Erroneously attributing the safety report to the hazard identification capabilities of the flight ops division would be an erroneous assumption. It was, after all, the contractor who identified the hazard and took the time to report the safety concern.
Related Aviation Safety Chart Articles
- How to Analyze Safety Reporting Performance in Aviation SMS Using Charts
- Safety Chart: How Effective Is Hazard Identification Training in Aviation SMS?
- Safety Chart: How to Discover Most Common Safety Issue in Aviation SMS
Understanding Safety Chart Data Sources for Accurate Interpretation
Other risk management scenarios can easily confound safety management teams' interpretation of these safety charts. The points that require careful consideration are:
- Wrongly attributing safety reporting metrics to employees within the division; and
- Assuming incorrectly the total number of safety issues whenever safety issues are "branched."
Another safety reporting example would be a "publicly reported safety issue" that was submitted by a passenger who is not an employee within the SMS. Again, passengers don't care about the data structure of their aviation SMS. They took the time to report the safety concerns. Their responsibility to report the safety issue has been fulfilled and they want to move on. It is up to the safety manager to determine which division the safety issue should be managed in. In this case, the safety manager simply selects the proper divisions, and the risk management process continues.
Whenever safety managers are determining the proper division for which a safety issue must be managed, there will be times when a particular safety issue logically belongs to more than one division. Take an airport that has an
- air-side,
- ground-side, and
- maintenance division.
A reported safety issue came in regarding a faulty fuel nozzle type that contributed to a fuel spillage. Equipment using this specialty fuel nozzle is used in both air-side and maintenance divisions. For the purpose of this discussion, these are "independent" divisions with their own processes and management. In this case, the safety manager may assign the initial safety issue to the air-side division, but the safety issue must also be addressed independently in the maintenance division. In this case, the safety issue will be branched (duplicated) and worked on independently in both divisions. We will have two separate safety issues and a responsible manager from each division will work on their assigned safety issue.
Why is this case special? Because the safety issue was:
- Reported by a third party that doesn't reflect your internal safety reporting culture;
- Routed/assigned to a division that was not involved in the hazard identification; and
- Branched to a second division, which can skew your safety reporting metrics if you are not aware of where the data originates.

In the immediate case above, a passenger reported one safety issue that was branched into two safety issues. The safety issue was duplicated and your SMS database will consider that two new safety reports entered the risk management process, but in reality, only one safety issue entered the system. This is an anomaly that SMS Pro simply absorbs and does not try to do anything fancy to rectify the safety reporting metrics.
Concerning “Proactive” issues, safety managers will need the ability to document an issue as “Proactive” if that issue demonstrates proactive hazard/risk identification. Whenever reported safety issues have a “proactive” status, the All Issues by Division chart will filter them when users select the “Proactive” box on the chart. This becomes important when management is interested in determining whether the SMS maturity level is progressing from the reactive risk management phase to the proactive risk management phase. Don't be mistaken that the number of submitted reactive safety reports should drop off. What you are looking for as your SMS matures is a higher percentage of proactively identified safety reports.
Finally, if your aviation SMS has integrated safety-quality assurance functionality, audits or prep audits will produce “findings” or "concerns" to be reported in your risk management tools as an audit issue. When a user clicks on the chart’s Audit filter above, for example, it will filter all safety issues by whether they are audit issues. By default, only audit findings will be reported as safety issues during the auditing process. In SMS Pro, there is a configuration setting that will also report any "audit concern" as a safety issue. Again, this is not a default setting and if you wish to capture and manage audit concerns in your SMS' risk management processes, your SMS Admin will have to configure this capability.
Related Aviation Safety Chart Articles
- Safety Chart: How to Track Safety Reporting Performance in Aviation SMS
- Safety Chart: Mandatory vs. Voluntary Aviation SMS Issues to Report
- Safety Chart: Learning Who Is (or Isn't) Involved in Your Aviation SMS
How This Data Relates to SMS Requirements
Because much of what this chart tells management has to do with the performance and efficiency of safety management teams, this chart is relevant to the Safety Assurance (SA) portion of the Four Pillars of aviation safety. This is because safety assurance ensures that safety data is collected and managed to appropriately predict risk and mitigation strategies.
Furthermore, because this chart can be filtered by proactive and audit issues, it also addresses the requirements for SMS compliance with parent organizations and management’s goals for moving from a reactive to a proactive safety culture.
Who Should Care About This Chart
Mainly, aviation safety management teams and department heads should be very concerned with this SMS performance monitoring chart. For one, it is a direct reflection of how efficiently they are promoting the SMS. Safety promotion and hazard identification training are two principal activities used to influence the numbers on this safety chart.
If an organization is beset by open safety issues, then the department head(s) or safety manager(s) in charge of the division(s) that are not properly managing safety issues should be very concerned.
Final Thought: Related Charts
SMS performance monitoring charts are crucial for the accountable executive to fulfill his responsibilities to the SMS. For every SMS implementation, accountable executives are responsible for making sure the SMS is properly implemented and performed in all areas of the organization. With a quick glance, this safety chart shows an accountable executive in which areas of the company are represented appropriately by measuring a key SMS activity, i.e., safety reporting.
Furthermore, the accountable executive must regularly review organizational safety performance. This is a requirement. To be effective and efficient at SMS performance monitoring, dashboard charts such as these can alert the accountable executive of substandard safety performance in particular areas of the company.
Almost every safety chart in an SMS database relates to safety reporting. There are links in this article to other related safety charts. If you have an idea for another safety chart that should be included in your SMS dashboard, let us know. We can create them for you.
If you find these charts useful for performance monitoring, you will also find the following free content of great value.
Last updated April 2025.


