Why Hazard Reporting Matters

Hazard reporting in aviation safety management systems (SMS) is the backbone of any safety program’s performance.
Every aviation safety program depends upon hazard reports for:
- mitigating operational risk;
- settings goals;
- determining Key Performance Indicators;
- complying with SMS regulatory requirements; and
- implementing relevant risk controls.
It’s important enough that when we talk about employee involvement in your aviation SMS, we are mostly talking about employee involvement in hazard reporting.
Of course, employee involvement is not a static thing – i.e., it’s not a “goal you reach” but something you improve and then maintain. Initially, your SMS will not have stellar hazard reporting metrics. Safety promotion activities boost employee involvement in the aviation SMS which leads to improved hazard reporting cultures.
Related Hazard Reporting Culture Articles in Aviation SMS
- Indicators of Good Hazard Reporting Culture
- How to Develop Safety Reporting Cultures in Aviation SMS
- Essential KPIs for Poor Hazard Reporting Cultures in Aviation SMS - With Free KPI Resources
When you implement your SMS, at a certain point your total number of monthly hazard reports will consistently be within a certain range. Optimal safety reporting cultures submit one report monthly for every ten to twelve employees. Based on this best practices statistic, if you have 400 employees participating in the SMS, you can expect 40 new safety reports each month.
Stable hazard reporting metrics can be an encouraging sign that employees are engaged in the aviation SMS, especially if that range meets or exceeds company goals. If it does not meet your goals, then you need to:
- Revise safety goals to reflect realistic outcomes in your working environment;
- Focus on safety promotion for increasing hazard reporting numbers; or
- Discover and overcome resistance to the SMS.
Why the Issue Comparison by Month Chart Is Important

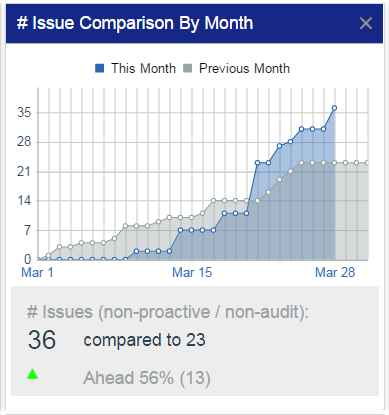
In the above cases, we can monitor the performance of your hazard reporting system using a simple, but powerful overlaid line chart. The "# Issue Comparison By Month" chart is extremely useful for safety teams and for accountable executives to monitor both the health and acceptance of aviation SMS.
This safety performance monitoring chart is not a complex chart and fits nicely on the dashboard of your SMS database solution. This simplicity makes the chart intuitive, beautiful, and incredibly helpful to keep an organization focused on hazard reporting goals.
Considering data management requirements, this chart shows you the current month's total reported safety issues in your company vs the number reported last month. The chart displays the total number of hazard occurrence reports by each day of the month, and at any point you can easily see if you are on or off track for meeting the previous month’s totals.
When creating an SMS performance monitoring chart such as this, you will need to consider which data types to exclude from the data set. Practical guidelines dictate that certain report types may skew your data or affect employee confidence in the SMS. As an example, consider these report types to exclude:
- Internal audit findings;
- External audit findings;
- Confidential and/or anonymous reports that may uncover a reporter's identity;
- Proactive hazard reports coming from inspections; or
- Proactive reports in response to safety promotion activities.
The last two points illustrate how proactive reports may skew safety reporting metrics, just as audit findings don't accurately reflect the intent behind a genuine hazard reporting program.
You may not have to worry about audit findings or inspection data skewing your data if you are using a spreadsheet or point solution to manage your hazard reporting processes. We purposely omit these data points because our SMS database treats many SMS activities as "issues" or "tasks" that:
- are assigned to responsible managers;
- have corrective actions and preventive actions to mitigate the risk; and
- require deadlines to track risk management performance.
Audit findings and concerns (issues) confound this chart, so we omit this data. You should do the same if you create a similar chart like this.
The reason that this hazard reporting performance chart is helpful is:
- If you are not reaching hazard reporting goals, you will want to consistently see improvements in the total number of current month’s reports; or
- If you are already reaching goals, you will want to verify via this chart that your monthly totals are consistent with the previous month.
Related Articles in Aviation SMS Proactive Risk Management
- What Is Proactive Risk Management in Aviation SMS?
- How to Practice Proactive Risk Management in Aviation Safety
- 4 Activities at the Heart of Proactive Risk Management in Aviation SMS
What This Chart Reveals About Your SMS

Of course, what this chart reveals about your risk management program depends on current trends in your SMS. But there are three main trends that this chart can be used to watch out for:
- Consistent hazard reporting culture;
- Improving hazard reporting culture;
- Declining hazard reporting culture; and
- Sporadic hazard reporting culture.
The first three trends are fairly straightforward in their implications for the SMS' safety culture. If your aviation SMS is consistently hitting similar numbers, then that’s a good indication your SMS has reached its current peak capacity – e.g.,
- capacity in terms of almost all potential issues being reported; or
- capacity in terms of the ability of the current employee group to report issues.
If you notice a month-of-month trend of consistent growth in hazard reporting, then hazard reporting culture is obviously improving due to safety promotion, change in scope of
- operations;
- work environment, or
- the dynamic of Teamwork with employees.
This chart reveals a very short trend. A maximum of two months of data is displayed in this chart. To detect trends that exceed this time period, you will need a trending chart that encompasses longer time intervals.
More Information on Trend Analysis in Aviation SMS
- Aviation Safety Managers' Best Friend - Trending Charts
- How to Use Trending Charts in Aviation SMS
- Six Steps How to Perform Trend Analysis in Aviation SMS
What to Watch Out For

- Declining hazard reporting culture; and
- Sporadic hazard reporting culture.
These points from above are definitely things to watch out for when evaluating the usefulness of this chart's data and taking appropriate actions.
If you are noticing a month-over-month trend of not reaching the previous month's reporting numbers, then it’s clear that your hazard reporting culture is declining. This can be due to deteriorating culture, change in season, change in scope of operations, and so on.
Declining trends in hazard reporting aren’t necessarily a red flag per se, as the decline can arise from very positive things, like a rise in the number of proactive issues, which this chart does not count and which would also not appear on this chart.
Sporadic hazard reporting culture is another thing to watch out for. One month your hazard reports are well above the last month, then consistent, then abnormally low, and so on. And what we are talking about here is not simply just natural month-over-month variance, but a dramatic difference every month. It should raise a few flag questions for month 1 (very high reporting) and month 2 (very low):
- What is the difference in operations between both months?
- Were there differences in staffing, employees’ teams, etc.?
- Which employees/departments were/weren’t reporting in both months?
Like declining hazard reporting culture, it can be a perfectly natural thing. Nevertheless, sporadic hazard reporting should definitely be understood and accounted for as one would expect a relatively similar number of potentially reportable issues every month.
Where This Data Comes From
Whether you have a professional aviation SMS database or a manual reporting system, this chart is easily generated for all sized SMS. It’s simply a total number of issues that:
- Are not SMS-related audit issues; and
- Are not proactive issues.
It’s as simple as tabulating the total number of company hazard reports and subtracting all issues that arose from audits or were marked as proactive during the hazard management process.
Final Thought: Other Similar Aviation SMS Charts
This chart is a 32,000-foot overview of your SMS. This is just what the accountable executive and upper management need to see to monitor the performance of the SMS, but more specifically, the health of the organization's safety reporting culture.
Having the ability to constantly monitor hazard reporting metrics in real time allows safety teams to be more responsive and adapt. This is an excellent chart to demonstrate to SMS auditors as they evaluate the health of the SMS. If you have a "paper SMS" or your organization's business objective is to merely "check the box," then I suggest you don't show this chart to anyone.
You cannot hide from this chart. If your SMS is a joke, nobody will be laughing when they see this chart in your performance monitoring dashboard. For companies who earnestly want to improve their SMS and to realize value from the SMS, this chart is GOLD!
Being a high-level, general view of your SMS' hazard reporting culture, many charts would align nicely and provide clarity. Here are just a few:
- Top Reporters Last 30 Days gives you a good indication of who has been contributing the most to your SMS safety culture;
- SMS Implementation Progress can help you set realistic hazard reporting goals based on how far into SMS implementation your program is; and
- Top 5 Hazard Categories will provide clarity about what types of hazards are being reported.
Hazard reporting is the backbone of every SMS. Making it easy for employees, vendors, and clients to report hazards should be a top priority. We can help.
See how quickly an employee can report a hazard in SMS Pro. You will also see how many options exist, including offline hazard reporting.
Can your accountable executive monitor the performance of his SMS? If not, here's a gift.
Last updated April 2025.


