Why Knowing Who Is Reporting Hazards Is Important

Hazard identification and subsequent hazard mitigation strategies are critical for successful, continued operations. Monitoring which groups of employees are reporting safety issues in your aviation safety management system (SMS) allows management to stay abreast of who is involved in the SMS.
Alternatively, knowing which employees are neglecting to report hazards is also useful information to safety professionals. This would indicate that safety promotion efforts or SMS training efforts need to be reinforced.
In short, we are most interested in which particular user groups are not fulfilling their responsibilities to the SMS. These employees introduce unnecessary risk to aviation operations.
How do you know which employee groups are not participating in the SMS? Can you determine this easily? We have some ideas to stimulate your SMS safety reporting system.
Safety reporting entails alerting management of
- hazards,
- accidents,
- operational irregularities; and
- close calls.
Every safety professional who understands the relationship between the SMS' safety assurance (SA) and safety risk management (SRM) processes understands that healthy safety reporting activities are critical to obtaining the maximum benefit from the SMS. Safety reporting activity results from employees and stakeholders engaged in system monitoring. As potential hazards and safety concerns are identified, they are reported to management through the confidential safety reporting system.
Without healthy safety reporting activity, the SMS' risk management processes will be missing out on one of the most important (SA) inputs. When employees in a particular area of operations do not participate in system monitoring and timely reporting of safety concerns, it is the accountable executive's responsibility to not only know about these non-participating employees but also the account executive's responsibility to address the substandard safety performance.
Negligent Employees Add Unnecessary Risk for Aviation Operations
It’s critical that every employee group is consistently identifying hazards and reporting issues. This includes:
- Front line, general employees;
- Department heads;
- Aviation safety managers; and
- Executive management.
A common misconception in aviation SMS is that:
- General employees' main SMS duty is reporting issues;
- And safety managers are simply in charge of fixing (managing/documenting) issues; and
- Executives are simply providing budget and oversight.
This misconception is a mistake. Each employee group has opportunities to report issues. Furthermore, each employee has a responsibility to report real or potential hazards as soon as possible.
Related Aviation Hazard Reporting Articles
- 4 Hard Truths About Hazard Reporting in an Aviation SMS
- Indicators of Good Hazard Reporting Culture
- What Is Missing Most in Aviation Hazard Reporting Systems
Why Each Employee Group Needs to Report Issues
The reason each employee group has opportunities to report issues (needs to be reporting issues) is because of an extremely important fact: Hazards and risks are not isolated to the "ground floor" of the working environment in aviation safety management systems.
Hazards and risks take the form of:
- Politics, including warring factions;
- Economic downturns (i.e., affecting safety budgets, new equipment, and maintenance activities);
- Executive management QMS business decisions;
- Safety regulation changes; and
- Emerging technological changes.
This list could be considerably longer, but the point is that credible hazards and risks exist in every employee group. These potential hazards affect aviation operations and SMS. A risk affecting executive management is no less relevant than a risk out on the tarmac.
When employee groups neglect to report hazards across the entire organization, the SMS is unable to collect data and identify trends. Safety managers are unable to see the entire scope of their operational risk profile when certain operational elements are omitted.
Accurate trend analysis reports generated in any aviation SMS are dependent on the quality and completeness of aggregated data. In short, garbage in, garbage out.
Related Aviation Trending Analysis Articles
- Aviation Safety Managers' Best Friend - Trending Charts
- How to Prepare Data for Trend Analysis in Risk Management Programs
- Six Steps How to Perform Trend Analysis in Aviation SMS
Analytical Points to Watch Out For

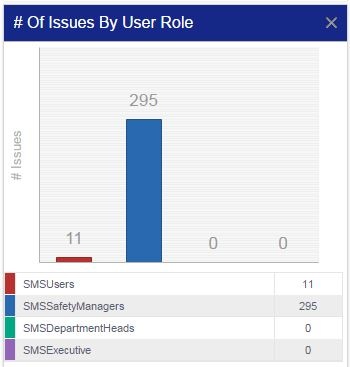
Now that you know the purpose and importance of an aviation safety chart, such as the one illustrated at the right, it should be clear what to watch out for:
- That all roles have been reporting issues; and
- No roles disproportionately share only a small fraction of the issues reported.
In the chart at the right, we see that Executives and Department Heads have not submitted any issues, whether the issues were:
- Identified hazards;
- Accidents;
- Incidents; or
- Other irregularities.
The sister chart of the "# Issues by Role" chart is the "Issue Report Spread" chart at the right.

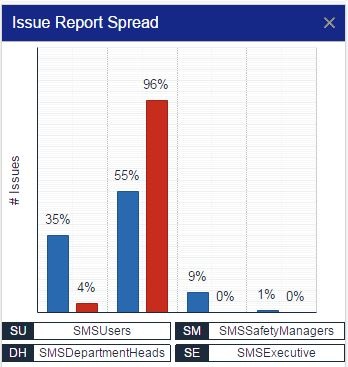
The Issue Report Spread chart takes the same information as the first chart but manipulates the data to determine the percentage of total issues each employee role has reported (red bar). Moreover, this chart also displays the percentage of company employees who share that role (blue bar).
This chart allows you to:
- Compare the percent of issue reporting to the percent of employees per role;
- Determine that the percentage of role reporting and percentage of users in the role are reasonable and consistent.
For example, a real-world scenario would NOT look like our extreme example to the right.
Notice that regular SMS users comprise 35% of our example company, but account for only 4% of reported issues. You would want to see a fairly equal match.
What Hazard Reporting Charts Reveal About Your Safety Culture
Indirectly, this chart acts as a measurement of aviation safety culture at all levels of an organization. For example:
- If there is an equal distribution of the “% of users belonging to a role in the company” and the “% of role’s reported issues”, then that means all roles are involved equally; and
- If one user role group is significantly reporting more safety issues than their role should, then those other roles need to become more involved in the SMS.
In our example above, SMS Executives and SMS Department Heads are not participating in hazard reporting. In a real-world scenario, this would be a serious red flag for the safety culture of those employees in the identified user groups. An astute safety manager would attempt to determine the root cause of these employees' absence from SMS participation. Corrective actions in these cases would include:
- Targeted hazard reporting training;
- Training on employee duties and responsibilities to the SMS;
- Safety promotion activities, such as newsletters, flyers, or banners;
- Safety surveys focusing on hazard reporting and employee SMS responsibilities; and
- Safety performance reviews focused on SMS participation.
Related Aviation Safety Culture Articles
- 3 Reasons Why Aviation Safety Culture Leads Directly to Safety Performance
- How Aviation Safety Managers Can Improve Safety Reporting Cultures
- 5 Simple Tips to Improve Aviation Safety Reporting Cultures
How This Safety Chart Is Created
If you are an SMS Pro user, you may want to understand the data behind the chart. For those of you who do not use this chart, but want to create your own using your own database or spreadsheet data, we'll offer some guidance.
Both displayed charts require several data elements to be created in your SMS database and these data elements are associated with the user and reported issue data.
- Your SMS database includes users with different roles in your company;
- Every hazard report is linked to the reporting user, if known (i.e. which user role reported the issue); and
- You have some means of filtering out the required information, such as with an aviation safety database.
Spreadsheets or point solutions can acquire this information without too much difficulty by using filters. Spreadsheets may be a clunky solution in this case. Most companies use spreadsheets as their repository for reported issues and storing reporter information, but I've never seen such a spreadsheet that captures data relating to user roles' departments. These more sophisticated operations are usually handled by SMS databases, such as SMS Pro.
Aviation safety databases generate this information automatically once the developers configure the report. Using a database to store SMS data is the best practice.
In SMS Pro, this chart is generated by the following workflow:
List the number of reported issues submitted by each user with the following roles
- SMSUsers – generic SMS Users role, but the user does not possess any of these roles: Safety Manager, Dept Head, SMSAdmin, SMSExecutive
- Safety Manager - has Safety Manager role but not (SMSExecutive)
- Dept Head - has Dept Head role, but not any of the following (Safety Manager, SMSExecutive)
- SMSExecutive - has SMSExecutive role, but not (Dept Head, Safety Manager)
All reported issues are included in this chart's data, except reports that have been
- Deleted;
- Generated from Public Reporting;
- Proactive;
- Sensitive (as determined by management);
- Anonymous or Confidential (as indicated by a reporter);
- User sensitive (as indicated by a reporter);
- Locked for safety committee review; and
- Generated from Audits.
If any of the above bullet points are true for an issue, that issue will not be included in this chart's data.
Extending Hazard Reporting Charts

The charts highlighted in this article exist in SMS Pro, which has very many pre-defined, analytical charts. Determining which user groups submit issues (or those users who are not participating) can be extended to other report types.
Whenever your SMS database has the ability to easily classify or categorize users, there will be an opportunity to generate meaningful reports on your hazard reporting culture.
For example, your SMS database may have features to classify or group users together by:
- Department;
- Division; or even
- Safety committees.
Spreadsheets are not designed with such flexibility. An SMS database will be required to easily generate these reports in real time. Otherwise, these reports will consume considerable amounts of time
- Collect hazard report data from all departments;
- Organize data to facilitate generating chart;
- Formatting the hazard reporting charts; and
- Reviewing charts to ensure the report is reasonable and accurate.
Safety managers who are most familiar with hazard reporting data are required in the last step. Don't rely on your IT staff to determine whether the data displayed is reasonable and accurate. The IT staff may not understand either of the:
- nature of the report; or
- frequency of reporting metrics by user group.
Safety managers understand the data driving the reports and they are better prepared to determine whether a chart's portrayal of the underlying data is reasonable and accurate.
Final Thought: Other Related Charts
These other hazard reporting charts that are useful to provide insight into your hazard reporting culture:
To learn more about safety charts, and how to maximize your use of safety data in your aviation safety management system, you may benefit from SMS Pro's SMS Administrator Course training.
Alternatively, the following will be helpful if you don't currently use SMS Pro:
Last updated July 2025.


