
What Is a Fishbone Diagram?

Fishbone diagrams are an excellent risk management tool for the root-cause-focused aviation industry.
If you are wondering how to use fishbone diagrams, you first need to know what a fishbone diagram is.
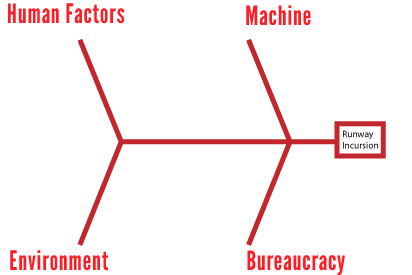
A fishbone diagram derives its name from its fish-like appearance, with a head and several fins. Each “fin” or “branch” of a fishbone diagram describes a different element of the failure. The head of the fishbone describes the risk.
Fishbone diagrams are also known as cause-and-effect diagrams or Ishikawa diagrams. In real-world environments, they are used for three primary purposes:
- Understand the causes and effects that lead to risks and undesirable events;
- Explore root causes of a safety issue; and
- Understand the relationship between causes and effects.
Related Articles on Using Fishbone Diagrams in Aviation SMS
- How to Use Fishbone Diagrams in Aviation SMS - Walkthrough
- Pros and Cons of Fishbone Diagrams in Aviation SMS
- 5 Proven Benefits of a Fishbone Diagram Library in Aviation SMS
The diagram uses its structure to understand all of the events and factors that lead up to the risk. Unlike a risk matrix, the fishbone diagram does not display any “subjective” elements such as likelihood or severity. Rather, it’s merely an objective way to understand root causes and subsequent events.
Also, fishbone diagrams are not concerned with the events that come after a risk, just simply the factors leading up to the risk. To create fishbone diagrams, it’s essential you understand exactly what a risk is.

1 – Understand Parts of a Fishbone
There are 4 parts to a fishbone diagram:
- The “head”: describes the risk of the situation, such as runway incursion, near miss, or flying close to a flock of birds;
- The “fins”: layout the categories or model you will use to analyze the risk, such as SHELL or 5-M model;
- The causes: the primary causes for each category
- The sub causes: (root causes) multiple factors that contributed to each case
When you understand the basic parts of the fishbone, it’s a fairly straightforward process for plugging in the appropriate data in the correct spot.
2 – Choose Framework and Add Fins
The first thing you need to do to complete a fishbone is choose your “framework.” While it’s not absolutely necessary to choose a framework, it keeps each fishbone diagram consistent. A framework could be:
- The 5-M model;
- The SHELL model; or
- A custom model you create yourself.
Each category of your model will be a single fin. The SHELL model has 4 categories, which would correspond to six main fins in a fishbone diagram. The 5-M model has 5 categories, which corresponds to 5 fins. A custom model may have more or less categories.

Once you have chosen your framework, it’s useful to create a fishbone diagram template with each fin representing a part of your model. You will use this template every time (ideally).
Related Aviation Risk Management Articles
- Difference Between Reactive, Predictive and Proactive Risk Management in Aviation SMS
- What Is the Process of Risk Management in Aviation SMS
- 3 Main Components of Aviation Risk Management
3 – Choose Head to Create Diagram
The next thing you need to do is fill in the “head” of your fishbone diagram. The head is where you will input:
- The risk that you are analyzing; and
- Problem statement of the risk.
What this means is that when you choose a safety event on which to create a fishbone diagram, you need to understand the risk of the situation you are analyzing. Misinterpreting this can lead to an inaccurate understanding of your aviation SMS' safety events. Remember that a risk is the point at which safety control is lost. Common risks we often see are:
- Flying in close proximity to birds;
- Runway incursions;
- Unauthorized vehicles near runway; and
- Loss of internet at airports.
The following are qualifiers that indicate the part of the situation you're analyzing is NOT correct:
- Your “head” entails “damages done” (i.e., bird strike, collision, etc.); or
- Your “head” is a threat rather than a risk (i.e., a flock of birds, fatigue, environmental conditions, etc.).
Your head statement should be concise and contain only the most basic wording to communicate what you are analyzing. This is usually accomplished in 5 words or less.

4 – “Why” Root Cause Brainstorm
This step is the critical process of how-to-create fishbone diagrams. In this step, you:
- Look at each category of fin;
- Ask “why” that category contributed to the risk, and you should come up with several reasons;
- For each reason, ask “why” again, and you should come up with 1-3 sub-reasons – these are your root causes
The end result of this “why” root cause brainstorm is to come up with a handful of root causes for each fin category. You can highlight the root causes that are especially influential in the current situation and that you might include in a classification report.
Related Aviation Risk Management Articles
- 3 Best Aviation SMS Risk Management Tools: Pros and Cons of Each
- How to Practice Reactive, Proactive, and Predictive Risk Management in Aviation SMS
- Most Common Aviation Risk Management Challenges at Airlines & Airports
5 – Fill in Fishbone

The last thing you need to do is fill in your fishbone diagram with the data from your “why” root cause brainstorm:
- Each reason will be a branch that extends perpendicular (usually horizontally) from the main fin line;
- Each sub-reason (root cause) will be a branch that extends perpendicular (usually vertically) from its parent reason; and
- Each line will include a 1 or 2-word summary of the reason/sub-reason
In general, fishbone diagrams will be thoroughly full of information. Sometimes branches may have very few reasons – and perhaps even none.
Final Thought: Goal of Fishbone Diagrams
The primary goal of fishbone diagrams is to help you understand in great detail why particular safety events occur. Basically, a fishbone diagram is a visual root cause analysis. Unlike other risk management tools that explore root cause analysis, such as a bowtie, a fishbone diagram’s root cause analysis is as thorough as it possibly could be. It includes:
- Primary root causes;
- Secondary root causes; and
- Contributing factors.
This is an excellent tool to help understand where specific risk controls failed. Fishbone diagrams are best used in conjunction with another risk analysis tool that analyzes events, consequences, and impacts following a risk event.
If your aviation SMS database lacks adequate risk management tools, then you may consider the following aviation SMS database solution, which comes with the fishbone diagram.

Last updated October 2025.
