Types of Aviation Safety Culture
While it is normal to say that safety culture is something you should pay attention to, it might be better to say that safety culture are things you should pay attention to.
Safety culture in aviation organizations is more than just one thing. There are multiple “types” of safety culture.
The five faces of safety culture you should consider are:
- Safety commitment
- Safety behavior
- Hazard reporting culture (which is a sibling of Just Culture)
- Safety awareness – how well can employees recognize threats and exposure in the environment?
- Adaptability to changes – how quickly can employees respond to safety information and events?
You cannot monitor aviation safety culture with one safety chart or one metric. You need a handful of dedicated charts to acquire a global picture of aviation safety culture in your aviation safety management system.
1 – Chart to Monitor Safety Culture Commitment and Attitude
Commitment and attitude are really two sides of the same coin. When we talk about safety commitment, it is usually in the context of management’s commitment to the safety program:
- Safety budget;
- Financial investment in safety program;
- Attitude of management towards quality performance vs. safety preparedness; and
- Degree of resistance/silos in management.
It should be clear whether or not your management is committed to the safety program. However, the safety attitude of front-line employees is harder to qualify/quantify. Employee safety attitudes are things like:
- Do employees agree with the SMS?
- Are employees willing to participate in the SMS?
- Do employees feel like the SMS benefits the quality of their work environment?
- Do employees feel like they have access to enough safety information?
These are important questions. Organizations with employees who have good safety attitudes are safer organizations, period. The best way to assess employees’ attitudes is with safety surveys. By taking surveys, you can chart the results onto a safety survey results graph. Over time, you will be able to assess the trend in safety attitudes. This is a good baseline for assessing the effectiveness of your safety promotion efforts.
2 – Chart to Monitor Safety Culture Behavior
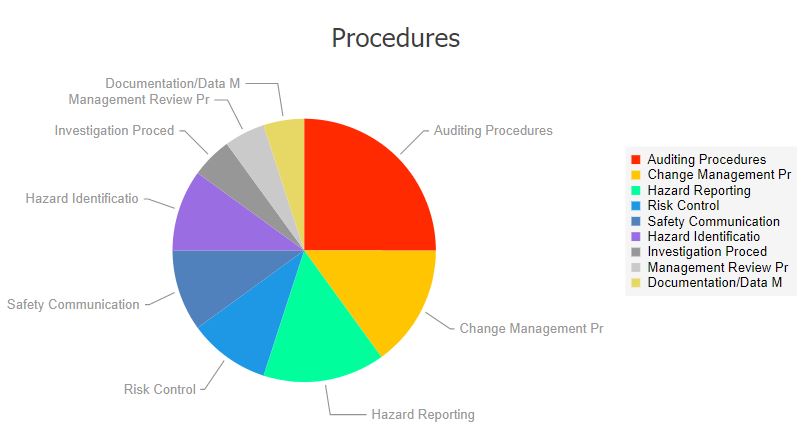
What are the employees in your safety management system doing when the boss isn’t watching? Are they following prescribed safety procedures? Employees who take shortcuts with tasks or prescribed procedures are unsafe. Safety management’s safety efforts depend on the assumption that employees are following prescribed behavior.
There are three important parts of safety behavior:
- How do employees behave in regard to prescribed safety policies/procedures?
- Do employees value safe behavior above personal differences?
- How do employees behave when no one is watching?
A great chart to assess this is the policies and procures classification chart. This chart shows which policies and procedures are implicated in safety issues. If a policy should be working, but it keeps being classified, it means either:
- Employees aren’t following prescriptions; or
- The policy/procedure needs to be revised.
A great chart to use in conjunction is the top Human Factors classification chart. If you find that employees not following directions is a significant contributor, then you know what your problem is.
3 – Chart to Monitor Hazard Reporting Culture (and Just Culture)
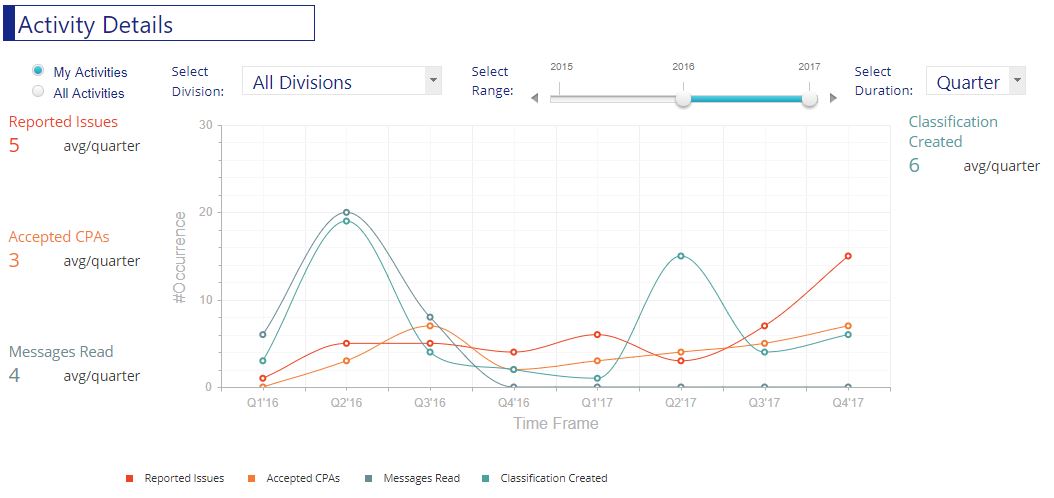
Hazard reporting culture is your baseline safety culture performance. If employees aren’t reporting issues, your safety program is a farce. Even if your SMS is riddled with other problems, so long as employees are submitting safety issues you can practice continuous improvement.
There are two charts you can use to monitor safety reporting culture:
- Number of hazard reports over time chart; and
- Individual employee number of reported issues chart.
These two charts give you an opportunity to assess the global hazard reporting culture and hazard reporting of each employee. Poor hazard reporting cultures can be in part a "human" problem, as well as a hazard reporting process problem. Other charts that are useful for assessing hazard reporting culture are:
- Average days to report an issue after being inducted into SMS;
- Top hazard reporters; and
- Hazard reports per department.
4 – Chart to Monitor Awareness
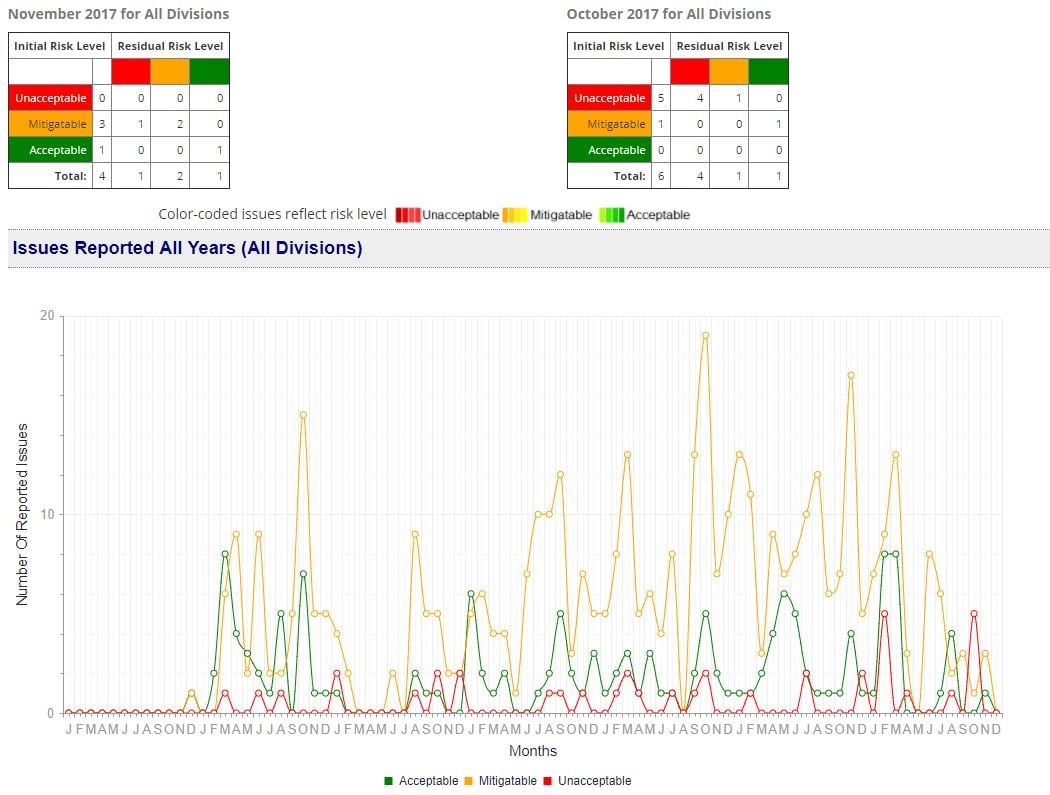
Instilling high-quality safety awareness may be the highest goal of a safety culture. Awareness is as critical important for identifying threats, root causes, and other types of exposure before safety is compromised.
Organizations whose employees have good safety awareness will feature a high percentage of low-risk issues. This is because issues are often reported early in the hazard-risk lifecycle (i.e., low risk!). Furthermore, as management continues to identify and implement risk controls, they will become more aware of the best methods for controlling risk – this also leads to a reduced number of high/medium risk situations.
Hence, a great chart for monitoring the trend of safety awareness in your organization is the number of hazard reports by risk level safety chart. This chart shows:
- Number of reported issues each month for the given year;
- Organized by initial risk assessment level; and
- Table of current time period initial assessments versus previous time period.
You can also compare data to the previous time period for an even more thorough understanding of the context of current trends in safety awareness.
5 – Chart to Monitor Adaptability
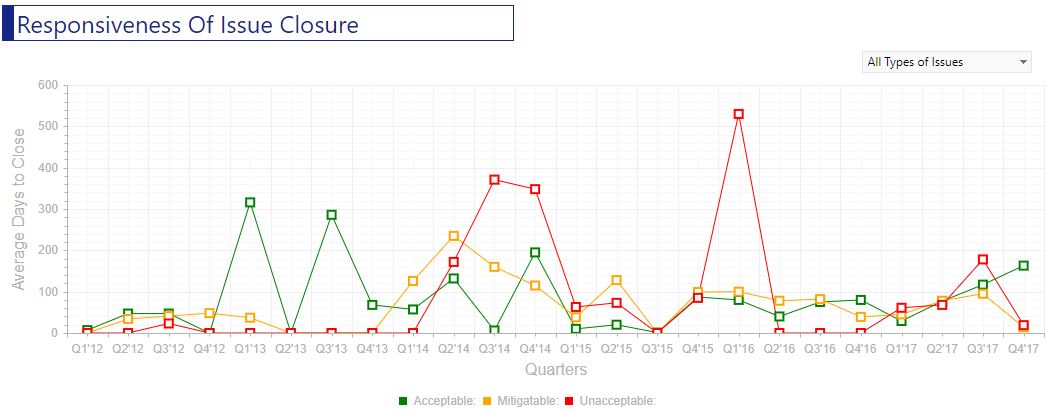
Your organization’s ability to adapt to change is a significant marker of overall safety culture. By adopting, we are talking about responding to changes in the operational environment. Two great charts to monitor adaptability are:
- On-time corrective actions closure percentage chart; and
- Average days close safety issue chart.
Both charts show how quickly your SMS can do the “Four I’s”:
- Ingest safety issues;
- Investigate what caused the problem; and
- Identify how to fix the problem;
- Implement change(s) with corrective actions.
Once the problem has been fixed, the issue can be closed/reviewed, hence the average days to close the issue chart. Programs that are highly adaptable feature:
- Management who is on top of implementing changes;
- Employees who are willing to perform corrective actions to enact the change; and
- Risk management processes that are efficient enough to process changes.
Adaptable aviation safety cultures should have low average days of close issues and a very high percentage of on-time CPA closures.
Review of Charts to Monitor Safety Culture in Aviation SMS
Once again, here are the best charts to monitor aviation safety culture in SMS:
- On-time corrective actions closure percentage chart
- Average days close safety issue chart
- Hazard reports by risk level safety chart
- Number of hazard reports over time chart
- Individual employee number of reported issues chart
- Policies and procures classification chart
- Top Human Factors classification chart; and
- Safety survey results.
Wondering what the safety culture score is in your SMS? Take this free quiz to find out how your SMS safety culture compares to the industry.
Last updated in December 2025.


