What Is Reactive Risk Management in Aviation SMS

Reactive risk management in aviation SMS is a technique that, mainly, involves the ability to respond to safety issues (or other types of issues, such as compliance, quality, etc.).
Reactive management is a response based approach to risk.
Practically, this means that anytime managers or front-line employees respond to an active threat in the operational environment (front-line employees) or to a safety issue that has been reported (management) they are practicing reactive risk management. This is an important fact because it demonstrates that reactive management is for:
- Managers;
- Front line employees;
- Upper management; and
- Anyone else in the capacity to respond to issues.
Reactive techniques are the first thing your organization will develop when you start your aviation safety management system. These techniques should be monitored and improved over the life of your SMS.
Importance of Reactive Risk Management
Unfortunately, reactive risk management is often falsely considered a “lesser” form of risk management than, say, proactive risk management. There is plenty of guidance online discussing moving from reactive to proactive.
While you certainly try and develop proactive and predictive risk management techniques, they should not “replace” reactive activities at all. Reactive, proactive, and predictive risk management have:
- Separate goals;
- Separate actions; and
- Are conducted in different situations.
Reactive activities will always remain one of your most valuable methods of managing risk. Why? Because issues will always arise that you need to react to.
If you develop other risk management techniques at the expense of your reactive strategies and tasks, you will see a decline in safety performance. Reactive risk management is characterized by:
- Ability to actively mitigate existing threats;
- Adaptability and resilience; and
- Ability to make good decisions as issues arise.
Reactive risk management is equally valuable for both management and front-line employees. In this article, we will focus on the chart that is most helpful for managers to practice.
Related Aviation Risk Management Articles
- How to Practice Reactive, Proactive, and Predictive Risk Management in Aviation SMS
- Going from Reactive to Predictive Risk Management in Aviation SMS
- Is Root Cause Analysis Proactive or Reactive?
1 – Top (KPI) Root Cause Classifications Chart
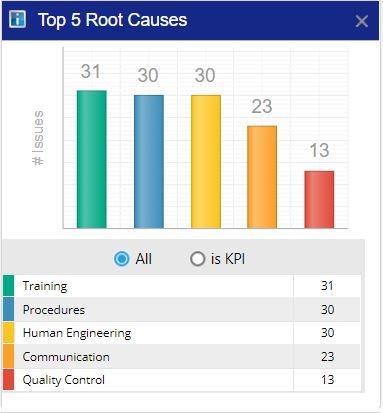
What is the top (KPI) root cause classification chart?
- Shows top root causes in your organization;
- Allows you to see all root cause classifications and only KPI root cause classifications; and
- Includes all data for the most recent year.
Why is this chart important?
- Root cause classifications are a primary target for risk controls;
- If you can control root causes, you can prevent hazard occurrence;
- Top root causes are root causes that you may not be properly controlled; and
- Gives you data for further investigation.
What you need to generate this chart:
- Automated safety management software; or
- List of all root cause classifications within last year.
2 – Top Hazard Classifications Chart
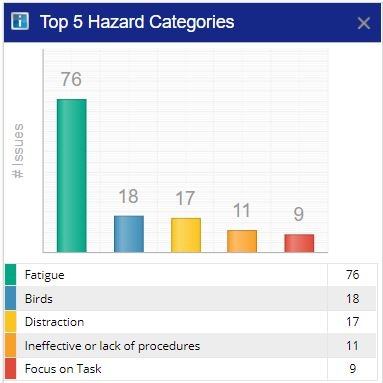
What is the top hazard classifications chart?
- Shows top hazards in your organization;
- See ALL top hazards or top KPI hazards; and
- All data for the past year.
Why is this chart important?
- Your top hazard classifications are a visual cue to what your most important safety needs are;
- Top hazards show areas of most likely exposure;
- Understand which risk controls are the highest priority (the ones assigned to your top hazards); and
- Understand which risk occurrences are most likely (the ones that your top hazards lead to).
What you need to generate this chart:
- Automated safety management software; or
- List of all root cause classifications within last year; and
- (Bonus) A list of risk controls associated with your top hazards.
3 – Issues by Location Chart?
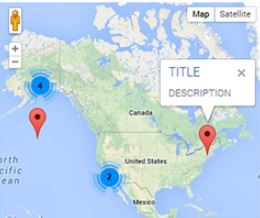
What are the issues by location chart?
- Shows a map of your operational environment;
- Shows dots for each location where a hazard was reported; and
- Can have multiple charts for each separate location.
Why is this chart important?
- Learn which specific locations in your company are more vulnerable than others;
- See trends in locations, such as many issues near runway; and
- Ascertain which further corrective preventative actions would help reduce exposure in localized areas.
What you need to generate this chart:
- Map of company;
- Data for each reported issue’s specific location.
4 – Daily Reported Issues Chart Past (Year or Half Year)
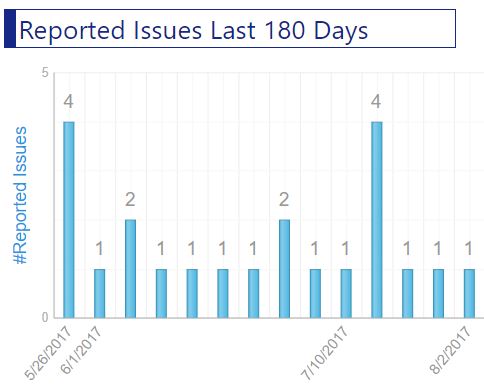
What is this chart?
- Shows number of issues reported each day;
- May include data for past year or half-year; and
- Best displayed in line chart or bar graph.
Why is this chart important?
- See trends in hazard reporting culture;
- Ensure that proper hazard reporting numbers are being maintained;
- See particular days or seasons where you may be more exposed, such as when you see sudden spikes in hazard reporting.
What you need to create this chart:
- List of all issues by date.
5 – Issues by Risk Assessment Level
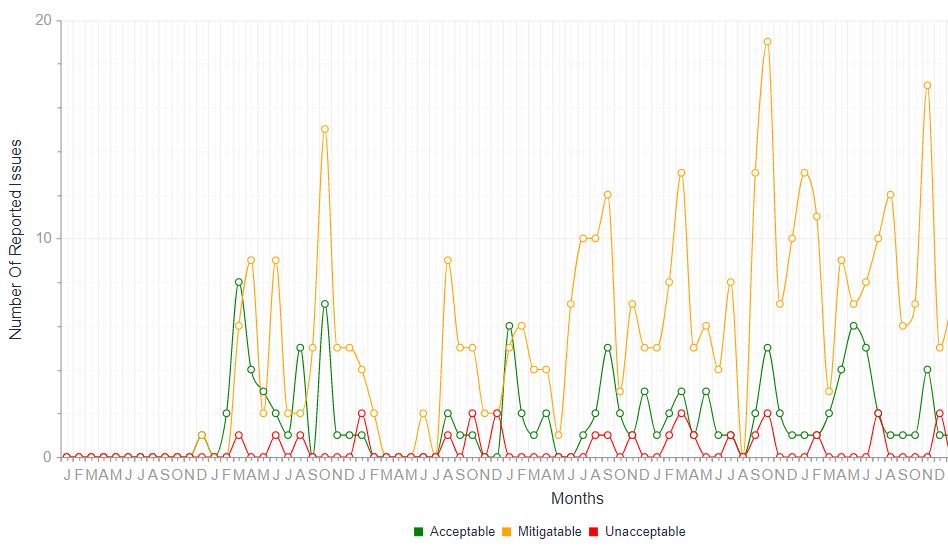
What is the issues by risk assessment level chart?
- Shows all reported issue’s initial risk assessment; and
- Organizes risk assessments based on assessment level.
Why is this chart important?
- See trends in severity of issues;
- Understand whether risk controls are working; and
- See performance improvement over time (i.e., less high-risk issues, more low-risk issues).
What you need for this chart:
- List of all issues initial risk assessment; and
- Period of each risk assessment.
6 – Identified Hazards Without Control Measures
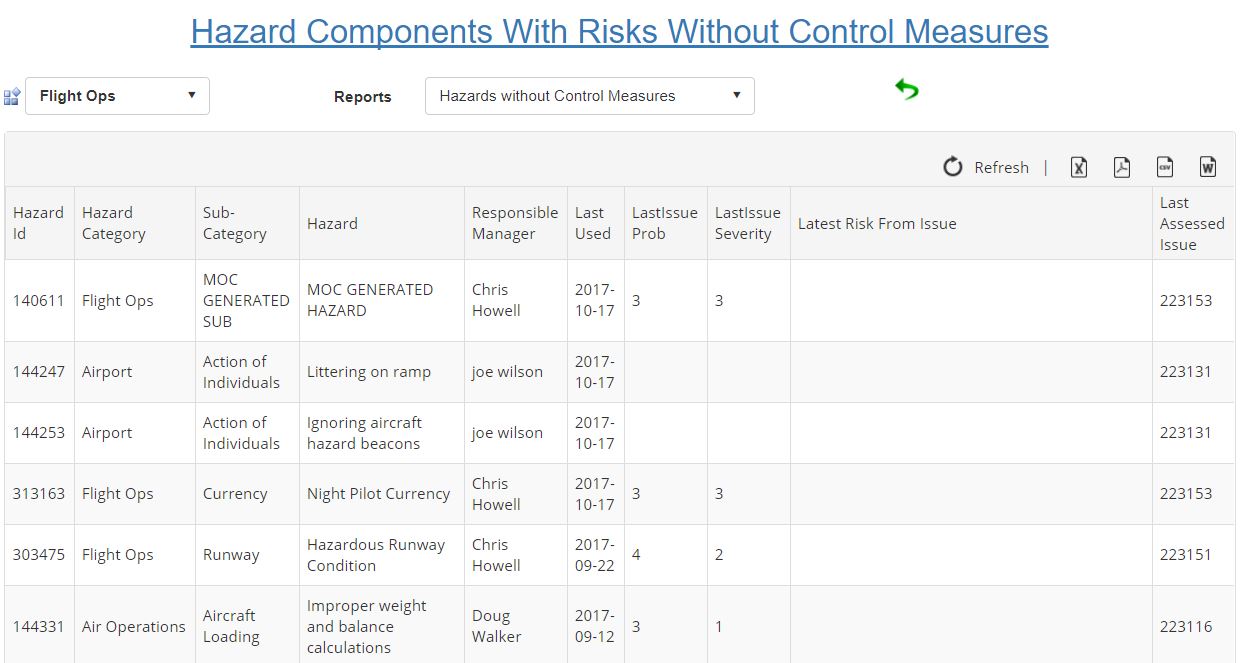
What are the hazards without control measures table?
- Shows a list of identified hazards in a company that has no assigned/documented risk controls.
Why is this chart important?
- Potential area of significant exposure; and
- Likely area of audit finding if not addressed.
What you need for this chart:
- Documented list of controls assigned to hazards.
7 – Most Ineffective Risk Controls

What is this chart?
- Shows the number of times each risk control has been positively/negatively associated with your company;
- These risk controls are ideally rated as part of your safety assurance process, on an issue-by-issue basis.
Why is this chart important?
- Monitor effectiveness of risk controls;
- Assess which risk controls need to be reevaluated or replaced; and
- Know which risk controls are keeping your organization safe.
What you need for this chart:
- Be able to flag risk controls positively or negatively on an issue-by-issue basis;
- Need to store that data for later data mining.
8 – Audit/Investigation Findings Past 2 Years
What is this chart?
- Displays a list of all safety audit findings in the past 2 years;
- May display a list of all audit concerns in the past 2 years; and
- May display a list of all investigation findings in the past 2 years.
Why is this chart important?
- Identify trends in non-compliance;
- Evaluate whether or not those non-compliance problems have been remedied.
What you need for this chart:
- List of all findings from investigations/audits in the past 2 years; and
- (Likely needed) further data regarding actions taken on those findings.
For more information about other great reactive risk management and performance monitoring tools, see the free e-book below for how to monitor safety performance.
Last updated October 2025.


